
Figure 3.
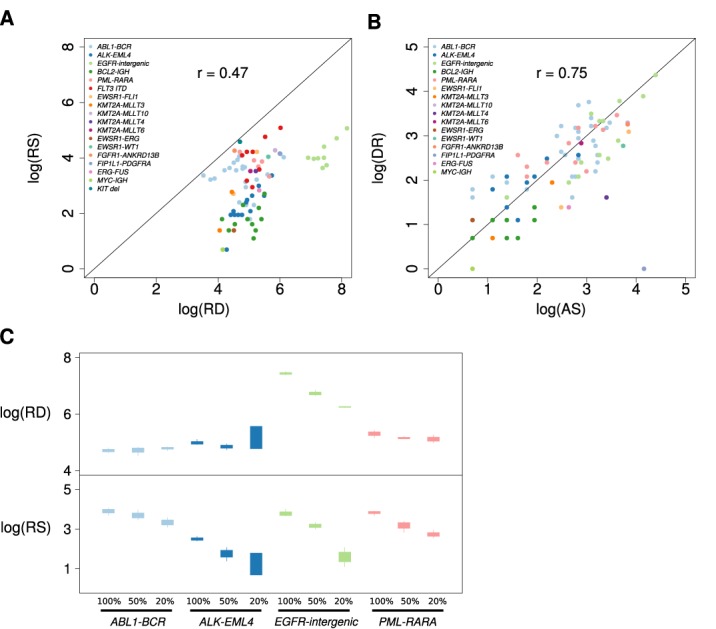
Plots displaying the relations between sequence read evidence and read depths. (A) A scatterplot showing the relation between the total read support (RS) for the known SV events identified from the BreaKmer analysis and the maximum sequence read depth (RD) observed at the inferred SV breakpoints on the log scale. Each point represents a replicate in which a true-positive call was made by BreaKmer, and the point color corresponds to the known SV of the sample replicate. (B) A scatterplot showing the relation between the quantity of the two types of sequence read evidence identified by BreaKmer for translocations. Each point represents a replicate with a known translocation that BreaKmer properly identified with the log transformed number of assembled reads (AS) on the x-axis and the log transformed number of discordantly mapped read pairs (DR) on the y-axis. (C) Boxplots showing the distributions of the BreaKmer inferred breakpoint read depth (RD, top panel) in relation to the amount of total read support (RS, bottom panel) of the identified known translocations for the four samples with tumor purity dilution replicates.