Figure 4.

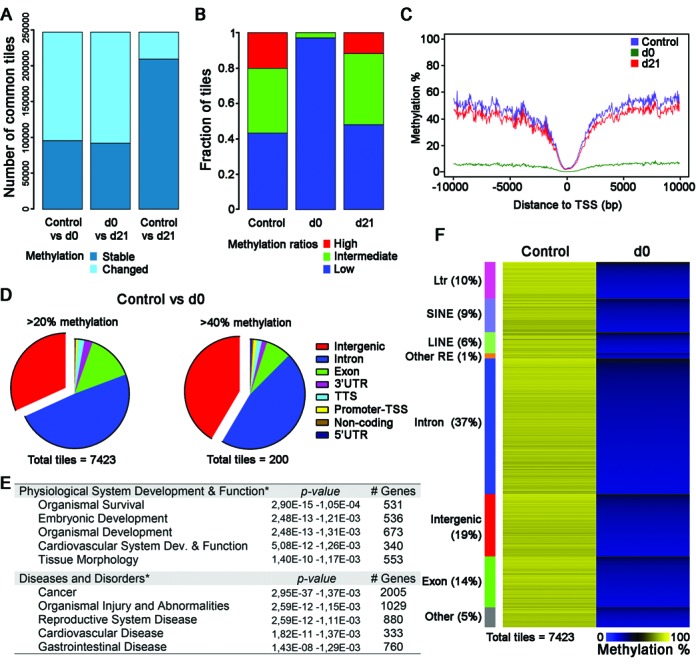
Global DNA methylation dynamics in ES cells subsequent to interruption and reactivation of Dnmt1 in Dnmt1tet/tet ES cells. Paired end sequenced RRBS libraries of control (n = 3), d0 (n = 3) and d21 (n = 4). (A) Pairwise comparison of 100 bp tiles that revealed unchanged (stable) and changed methylation levels during inactivation of Dnmt1 (control versus d0), recovery of Dnmt1 (d0 versus d21) and subsequent to transient suppression of Dnmt1 (control versus d21). Methylation variance cut offs of ≥20% and T-test P < 0.05. (B) Fraction of 100 bp tiles with high (>80%), intermediate (20–80%) and low methylation (<20%) values in ES cells with active (control), inactive (d0) and recovered (d21) Dnmt1 expression. (C) Methylation mean surrounding the transcription start site (TSS) for all tiles in each treatment group. (D–F) Attributes associated with the differentially methylated regions observed between control and d0 Dnmt1tet/tet ES cells. These regions conserved considerable DNA methylation levels in the absence of DNMT1. (D) Representation of tile features that revealed a loss of at least 20% methylation at d0 compared to control, but still retained a portion larger than 20% (n = 7423) or 40% (n = 200) methylation of original levels. (E) Summary of biological functions associated to the genic related tiles that conserved at least 20% and 40% methylation of original levels at d0. Unique gene identifications were used for biological function associations. (F) Heat map representation of methylation levels among the 7423 tiles. Tiles were first clustered for presence of repeat elements, tiles without these classes were clustered for genic location in the genome, then were sorted for methylation levels at d0 within each cluster. Sequencing data use in (A)–(F) included all 100 bp tiles with >20-fold coverage. See also Supplementary Figures S5–S9 and Table S3.
