Figure 5.

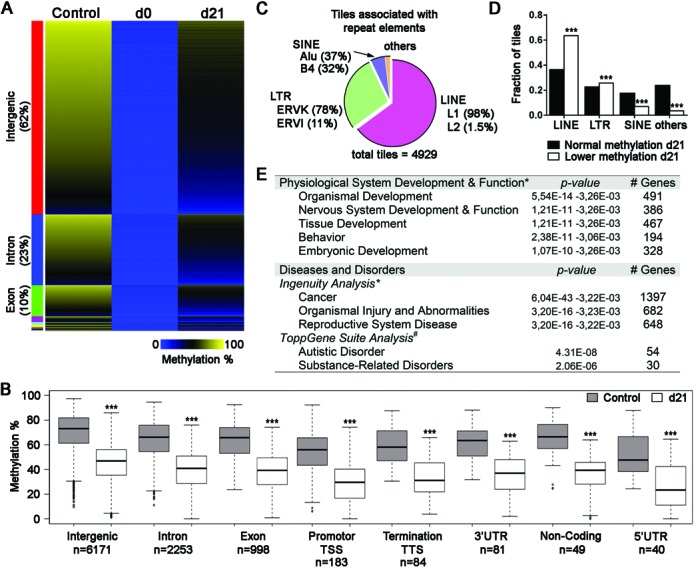
Suppression followed by reactivation of Dnmt1 reveals specific functional classes affected and methylation deficits similar to imprinted genes. Genomic regions that exhibited altered methylation levels subsequent to the interruption and reactivation of Dnmt1 in Dnmt1tet/tet ES cells. (A) Heatmap representation of methylation levels for 9884 tiles that lost methylation at d0 and did not recover their original levels by day 21 (methylation variance >20% and P < 0.05). Methylation levels were clustered by genomic regions and sorted by intensity displayed in control Dnmt1tet/tet ES cells within each cluster. (B) Distribution of annotated sequence features presented in (A). ***P < 0.001 between control and d21 of same class, by Wilcoxon test. (C) Proportion of hypomethylated tiles at d21 associated with repeat elements (n = 4929). (D) Repeat element class distribution in tiles with normal methylation at d21 and tiles with loss (lower) of methylation at d21. ***P < 0.001 between normal and control of same class, by χ2-test. (E) Summary of biological functions associated with the genic related tiles that showed altered methylation levels at day 21. Out 3688 genic region tiles, 2353 coded for unique gene identifications and *2313 qualified for biological function by IPA software, and #1964 qualified for biological function by ToppGene Suite software. See also Supplementary Figures S10–S14 and Table S4.
