
Figure 4.
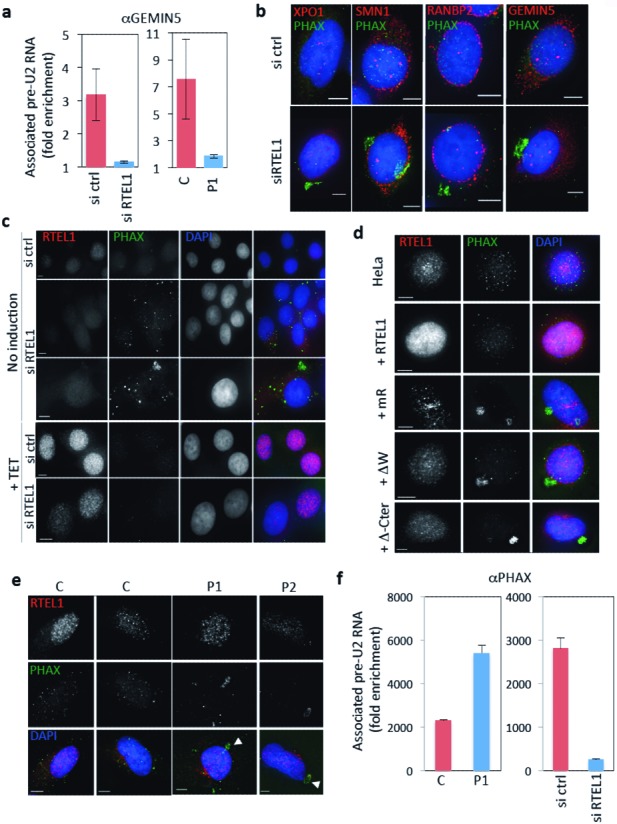
Dysfunctional RTEL1 leads to defects in the traffic of RNP components though the cytoplasm. (a) RNA-IPs using cytoplasmic lysates and anti-GEMIN5 antibodies to detect its interaction with pre-U2 show a deficiency in the formation of the cytoplasmic complex both in RTEL1-depleted cells (left) and in RTEL1-HHS patients (right) (C: control cells; P1: Patient's cells). Cells were treated with cyclohexamide. Levels are expressed as fold enrichment compared to control IgG. Western blot (whole cell extracts) illustrating the level of RTEL1 depletion is shown in Supplementary Figure S4a. (b) IF experiments using antibodies against PHAX (in green) shows abnormal accumulation of the protein in the cytoplasm of cells depleted for RTEL1. The localization of other proteins such as XPO1, SMN1, GEMIN5 or RANBP2 (all in red) is not perturbed. Cell preparations were fixed in PFA without pre-extraction (scale bar 5 μm). (c) Induction of expression of RTEL1iso6 in siRNA RTEL1-treated cells counteracts the accumulation of PHAX in the cytoplasm indicating that the phenotype is due to RTEL1 depletion. HeLa cells carrying a TET-inducible cassette controlling the expression of WT RTEL1iso6 were transfected with the siRNA RTEL1 or siRNA ctrl and tetracycline was added or not after 4 days for 24 h. Cell preparations were fixed in PFA without pre-extraction (scale bar 5 μm). Western blots (whole cell extracts) confirming the levels of depletion and induction are shown in Supplementary Figure S4b. A quantification of this experiment is shown in Supplementary Figure S4d. (d) Coarse accumulations of PHAX (in green) are also detected in HeLa cells induced for the expression of RTEL1 variants carrying mutations in the Walker domain (ΔW), the RING domain (mR) or missing the last C-terminal domain (Δ-Cter). A quantification of these data is presented in Supplementary Figure S4e. RTEL1 is shown in red (scale bar 5 μm). Cell preparations were fixed in PFA without pre-extraction. (e) Cells from HHS patients (P1 and P2) carrying RTEL1 mutations also show coarse accumulations of PHAX (shown in green, arrows) in the cytoplasm. Cell preparations were fixed in PFA without pre-extraction (scale bar 5 μm). Quantification of these data is presented in Supplementary Figure S4g. (f) Pre-U2 RNA IPs using anti-PHAX antibodies in cytoplasmic lysates. In RTEL1-HHS patients’ cells (P1), the levels of pre-U2–PHAX complex detected in the cytoplasm is increased, compared to the control fibroblasts (C, left histogram), whereas the levels of this complex is decreased in RTEL1-depleted HeLa cells, as expected from the export defect, compared to control (right histogram). Values represent fold enrichment compared to IgG control.