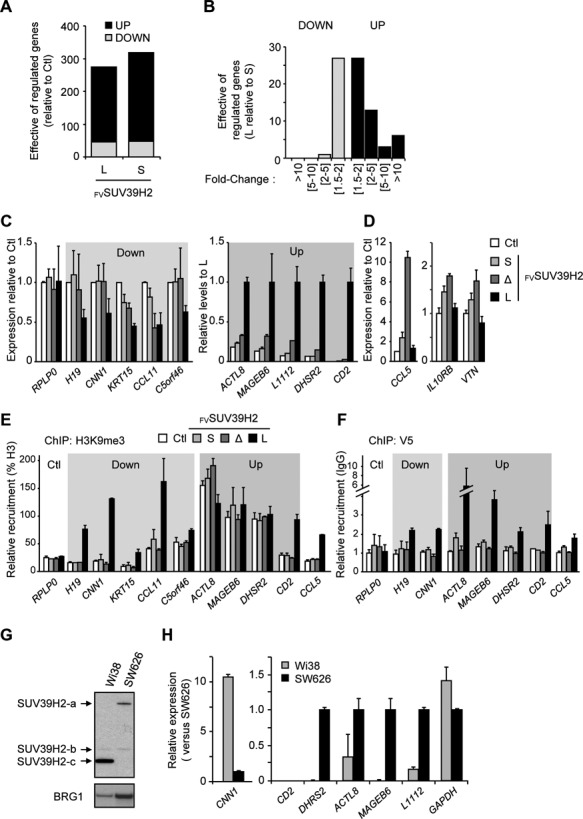
Figure 5.

Alternative inclusion of SUV39H2 exon 3 modulates the expression of target genes. (A) Graph showing the number of genes that are up- or down-regulated in HeLa cells expressing FVSUV39H2-L or FVSUV39H2-S. Gene expression levels were assessed by high throughput RNA sequencing and hits were retained with a threshold of 1.5 fold-change (P-value < 0.05) when compared to control (Ctl, virus generated with empty construct). (B) Graph displaying the differential effect on gene expression of FVSUV39H2-L versus FVSUV39H2-S. Number of genes is displayed in function of expression fold change. (C and D) Validation of 13 genes differentially affected in their transcription by SUV39H2 isoforms. Transcription levels were analyzed by RT-qPCR and quantification was displayed as means ± s.e.m. of three experimental replicate. (C) Five genes down-regulated by the over-expression of FVSUV39H2-L (Down) were shown relative to control (Ctl). RPLP0 gene is shown as unaffected gene. Five genes up-regulated by the over-expression of FVSUV39H2-L (Up) were presented relative to the expression in presence of FVSUV39H2-L (set to 1). (D) Expression analysis of three genes up-regulated specifically by FVSUV39H2-S and –Δ isoforms. Transcriptional levels were expressed relative to control (Ctl). (E and F) Analysis of H3K9me3 and SUV39H2 isoforms at promoters of target genes. Chromatin from cells expressing FVSUV39H2 isoforms or not (Ctl) was immunoprecipated with antibodies to H3, H3K9me3, V5 tag or nonimmune (IgG). Relative enrichments were measured by qPCR using primer sets targeting promoters of indicated genes. Values are means ± s.e.m. of three independent experiments. Amounts of H3K9me3 are expressed in percent of H3 (E), and amounts of FVSUV39H2 isoforms are expressed relatively to IgG control (F). (G) Endogenous SUV39H2 isoforms expressed in WI38 and SW626 cell lines were detected by western blot. (H) Relative gene expression in WI38 and SW626 cells of seven hits validated in panel 5C were quantified by RT-qPCR. CD2 gene expression is not detectable in both cell lines.
