
Figure 3.
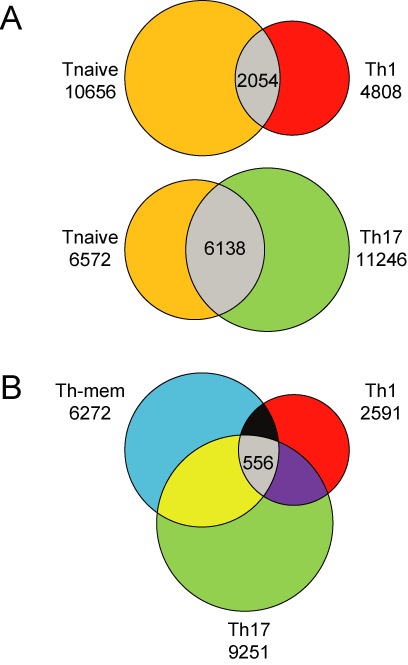
Shared and uniquely demethylated regions within Th cell subsets. (A) The two-way Venn diagrams display the distribution of demethylated regions between naive T cells (orange) and Th1 (red) or Th17 (green) cells. (B) The three-way Venn diagram compares the distribution of those regions between Th-mem (blue), Th1 (red) and Th17 (green) cells. Numbers indicate the uniquely or shared (gray) demethylated regions at a probability threshold of 25%.