
Figure 4.
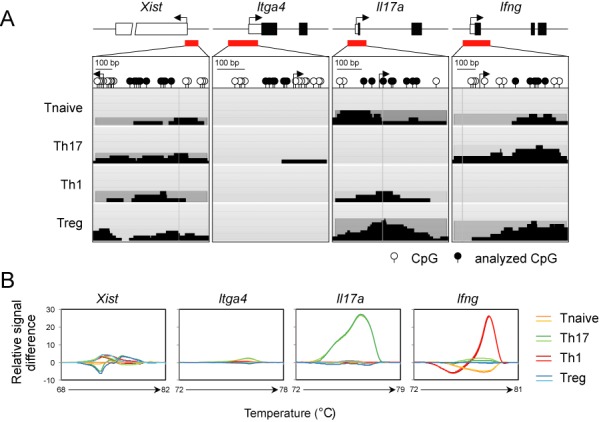
Differential methylation of control regions within Th cell subsets. (A) Locus organization and CpG motif distribution are shown for the loci Xist, Itga4, Il17a and Ifng. Pyramidal-arranged black bars display precipitated DNA-fragments that were combined into a DNA region. The maximum height of the overlapping fragments represents the MBD-seq activity. (B) Difference plots derived from high resolution melting analysis of regions described in (A). Analyzed CpG motifs are marked in black. Relative signal difference at each temperature was calculated and plotted by comparing differences between the melting curves of each subset. The experiment was performed twice. Representative plots are shown.