
Figure 7.
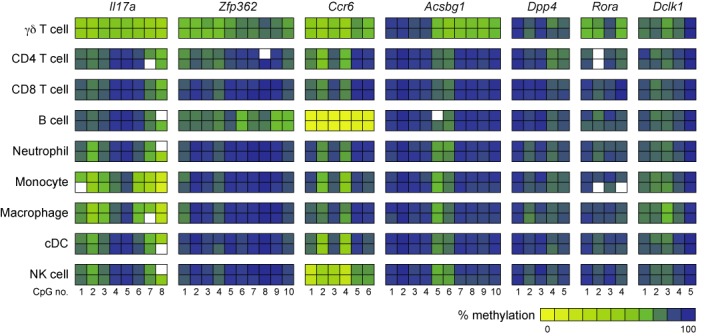
Detailed methylation analysis of the Th17-specific epigenetic signature genes in major immune cell subsets. Detailed analysis of the methylation status of the candidate DMRs was performed by pyrosequencing using genomic DNA from the indicated immune cell subsets. The methylation rates were translated into a color code from yellow (0%) via green (50%) up to blue (100%). Each rectangle represents the methylation of one CpG motif. Data from two independently performed cell sorts are depicted.