
Figure 1.
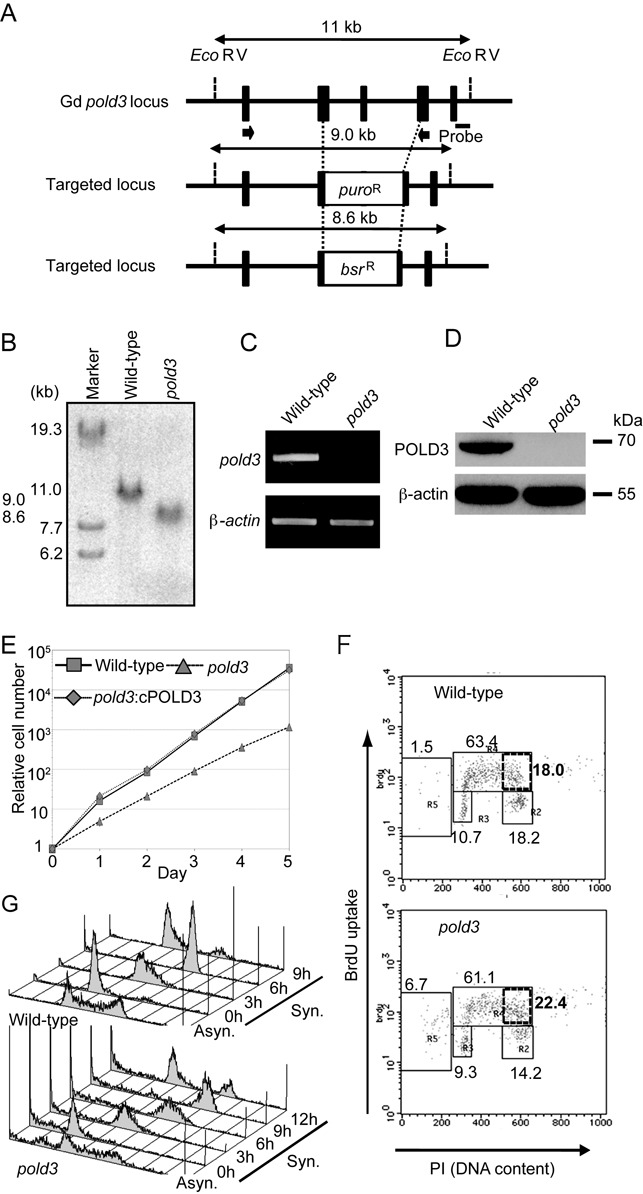
pold3 cells exhibit a prolonged S-phase. (A) POLD3 disruption in DT40 cells. The wild-type chicken POLD3 locus from exon 6 to exon 8 was replaced by a puro or bsr selection-marker gene. Targeted loci (middle and bottom) are shown and compared with the relevant chicken POLD3 genomic sequences (top). Solid boxes indicate the position of the exons. Relevant EcoRV sites and the position of the probe used in the Southern blot analysis are indicated. Black arrows indicate the position of primers used for RT-PCR in (C). (B) Disruption of POLD3 was confirmed by Southern blot. (C and D) Depletion of POLD3 mRNA and POLD3 protein in pold3 cells was confirmed by RT-PCR (C) and western blot (D). β-actin was used as an internal control. (E) Relative growth rate plotted for the indicated genotypes. (F) Representative cell-cycle distribution for the indicated genotypes. The top of the box, and the lower left, lower right, and left-most gates correspond to cells in the S, G1 and G2/M phases, and the sub-G1 fraction, respectively. The sub-G1 fraction represents dying and dead cells. The percentage of cells in each gate is indicated. The box outlined with bold lines corresponds to cells in the late S phase, with the bolded number indicating the percentage of cells. (G) Cells of the indicated genotypes were synchronized at the G1 phase with elutriation and released into culture. Cell-cycle progression profiles after release are shown.