
Figure 3.
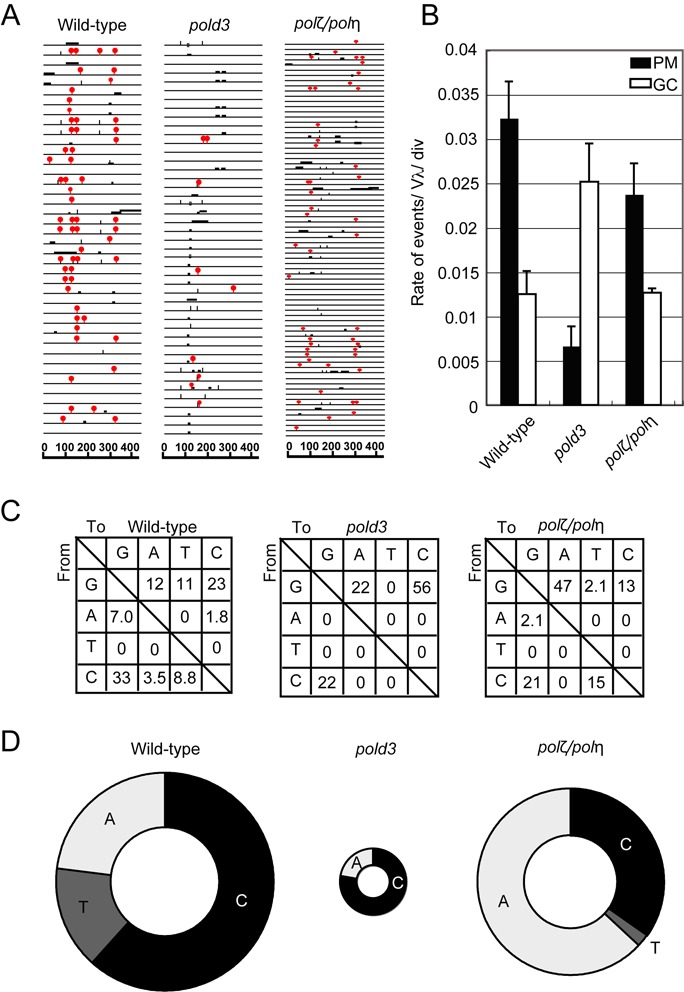
The important role of POLD3 in TLS past abasic sites during Ig Vλ hypermutation. (A) Ig Vλ segments isolated from indicated cells, clonally expanded for two weeks. Horizontal lines represent the rearranged Ig Vλ (450 bp), with hypermutation (red (gray in print) lollipop shapes), gene conversion (horizontal bars), single-nucleotide substitutions that could be the result of hypermutation or gene conversion (vertical bars) and single-base deletion (boxes) determined as described previously (34,35). More than three clones were expanded for two weeks and analyzed for each dataset. (B) The rates of gene conversion (GC) and hypermutation (PM) are indicated with standard error. (C) Pattern of point mutation in wild-type, pold3 and polζ/polη cells. Tables showing the pattern of mutation in each line, given a percentage of mutations observed. (D) Frequency of mutagenic base insertion of C, T or A opposite C on either strand, corresponding to mutation from C to G, A and T, respectively. The size of the pie charts reflects the frequency of overall point mutation within mutated sequences, while the segments reflect the relative use of C, T or A in bypass.