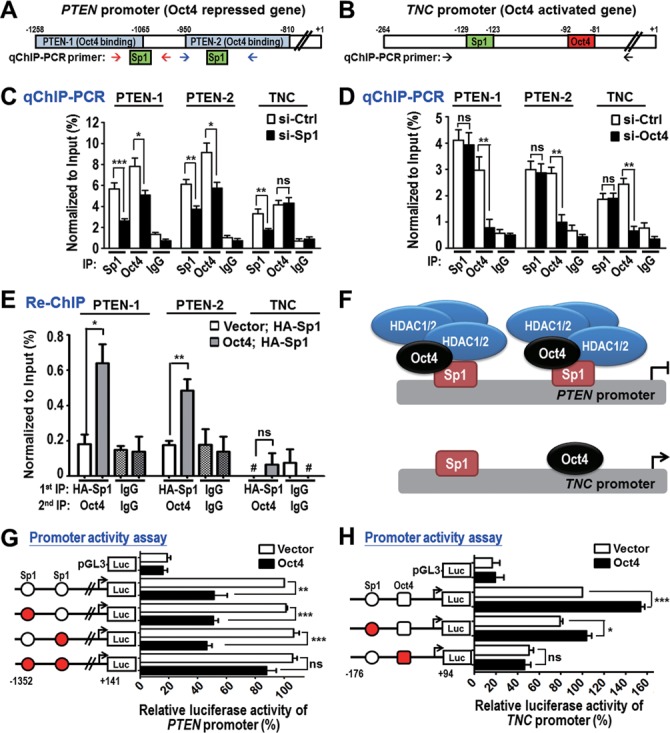
Figure 4.

Differential targeting and regulation of Oct4 and Sp1 on PTEN and TNC promoters. (A and B) Promoter regions of PTEN (A) and TNC (B) were analyzed. Oct4 ChIP-seq regions (blue; PTEN-1 and PTEN-2), Sp1 binding site (green) and Oct4 binding site (red) are shown. qChIP-PCR primers for amplification of PTEN-1, PTEN-2 and TNC promoters are indicated by arrows. (C and D) qChIP-PCR analysis of Oct4 and Sp1 occupancies at PTEN and TNC promoters in A549 cells stably expressing Oct4 after knockdown of Sp1 (si-Sp1) (C) or Oct4 (si-Oct4) (D) compared to si-control (si-Ctrl). (E) Re-ChIP assay was performed in control (vector) and A549 cells stably expressing Oct4 (Oct4) with overexpression of HA-tagged Sp1 (HA-Sp1). Sequential IP was performed using anti-HA antibody, followed by anti-Oct4 antibody. #, no detectable signal; ns, non-significant. (F) Working models of differential targeting of Oct4, Sp1 and HDAC1/2 complex at PTEN and TNC promoters. (G and H) Dual luciferase activity assays were performed using PTEN promoter (G) or TNC promoter (H) containing WT (white circle), mutant Sp1 binding site (red circle) and/or mutant Oct4 binding site (red square) in A549 cells overexpressing vector control or Oct4. Data are mean ± SEM. (n = 3). P-values determined using two-tailed Student's t-test. *P<0.05; **P<0.01; ***P<0.001.
