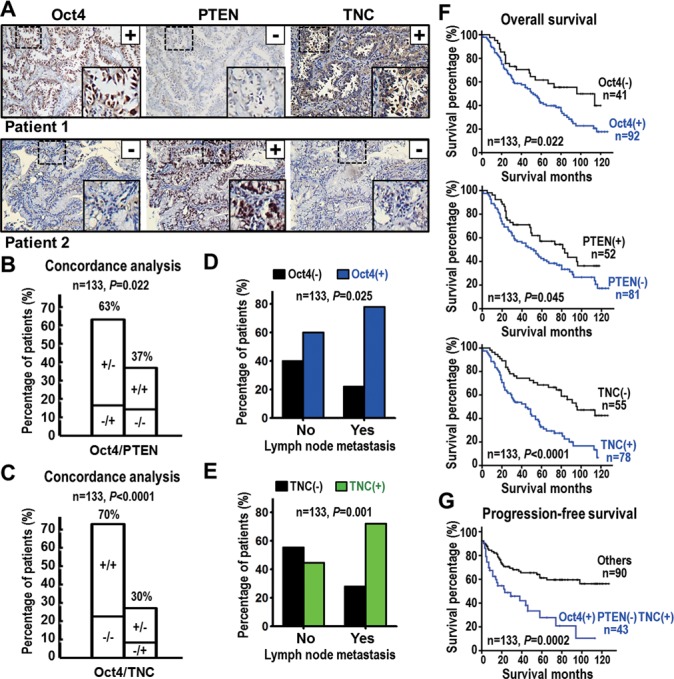
Figure 8.

High Oct4 protein coincides with low PTEN and high TNC levels and poor survival of lung cancer patients. (A) Representative IHC images of Oct4, PTEN and TNC proteins in tumor specimen of lung cancer patients. Oct4 positive immunoreactivity (+), PTEN negative immunoreactivity (–) and TNC positive immunoreactivity (+) were found in patient 1, whereas patient 2 shows a reverse pattern. Original magnification × 200. The insets are a higher magnification of the boxed areas. (B and C) Concordance analysis between Oct4 and PTEN (B) or TNC (C) proteins expression (+, positive immunoreactivity; –, negative immunoreactivity) according to the four molecular subtypes. The percentage of the concordant group (left columns) and discordant group (right columns) is indicated above. (D and E) Histogram showing frequency of high Oct4 (D) or high TNC (E) protein expression in patients with different lymph node metastasis status. (F) Overall survival curves of Kaplan–Meier method indicated that patients with high Oct4, low PTEN or high TNC expression had significantly poorer survival than patients with normal expression of the corresponding protein. (G) Progression-free survival analyses indicated that patients with high Oct4 combined with both low PTEN and high TNC expression had significantly poorer survival than other patients. P-values for correlation analyses (B–E) were determined using Pearson χ2 test; and for survival analyses (F and G) using log-rank test.
