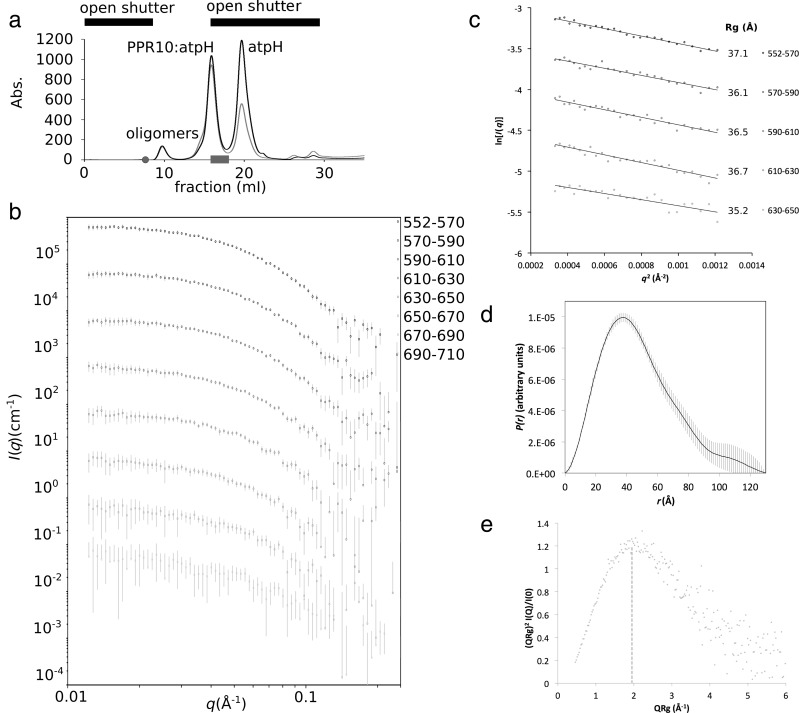
Figure 1.
SEC-SY-SAXS of PPR10:atpH. (a) Size exclusion chromatography trace of PPR10:atpH showing peaks corresponding to oligomers, PPR10:atpH complex and unbound atpH RNA. Black bars indicate the part of the chromatogram for which SAXS was collected by opening the beamline shutter. The grey circle indicates position where the first data frame was recorded, and the bar, the region corresponding to frames 552–710. (b) Scattering profiles of the PPR10:atpH complex averaged across 20 frame segments, corresponding to the second half of the PPR10:atpH peak (grey bar in (a)). (c) Guinier analysis of the low-q scattering data for the five most strongly scattering 20 frame segments indicates a radius of gyration of 36 Å. (d)P(r) distribution for frames 552–710 indicates a maximum dimension of 125 Å. (e) Dimensionless Kratky plot is diagnostic of a globular but somewhat extended protein.

