
Figure 3.
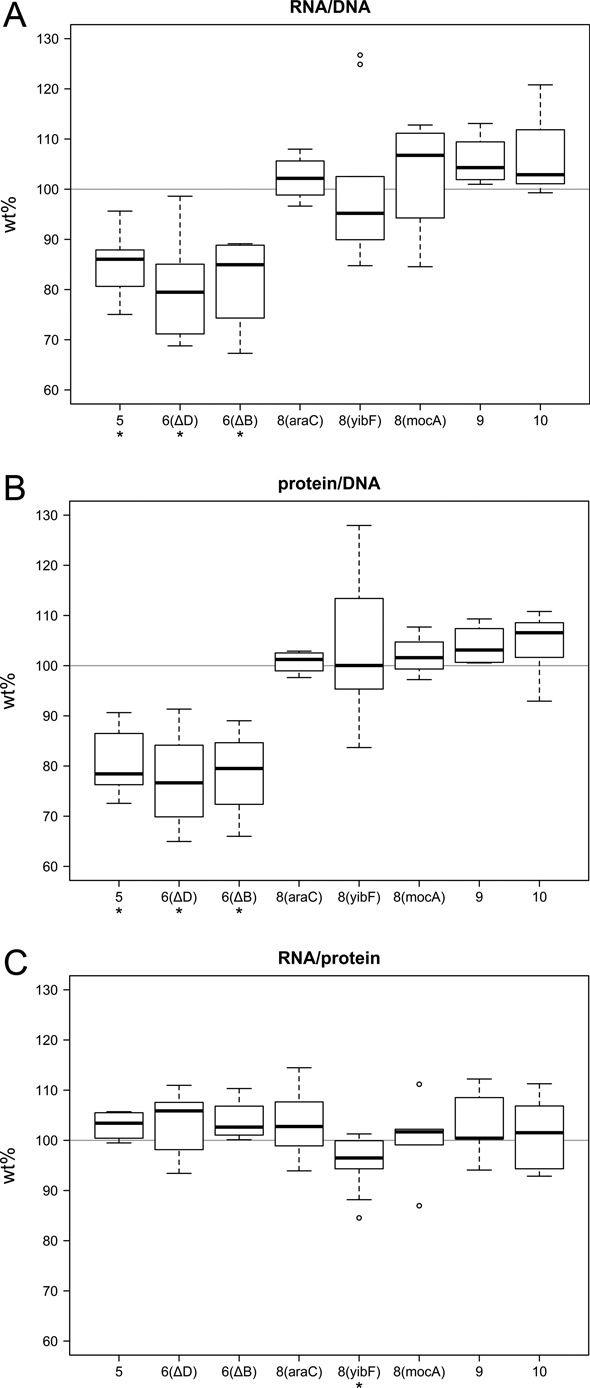
RNA and protein content of the cells with various rrn operon numbers, compared to the values of wt (MG1655) cells (100%). The RNA (A) and protein (B) content is normalized to DNA content. RNA:protein ratios are shown in (C). Strains are labeled by their rrn operon number and the site of the operon modification. Center lines show the medians; box limits indicate the 25th and 75th percentiles; whiskers extend 1.5 times the interquartile range; and outliers are represented by circles. At least five measurements per strain were performed (compared to the wt in each experiment). Asterisks indicate significant difference compared to the wt (*P < 0.05, paired samples t-test).