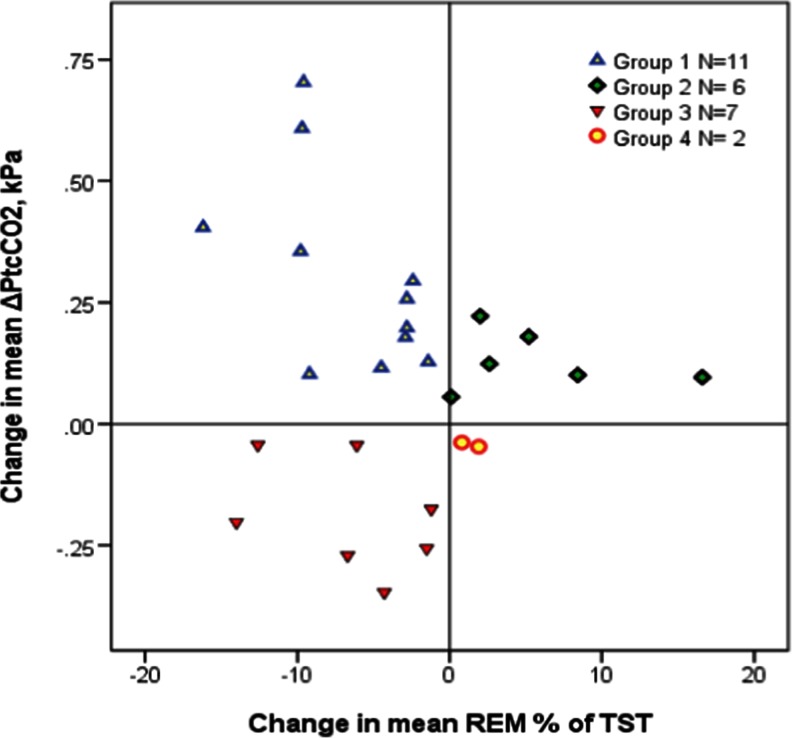
Fig. 2.
Alcohol-induced changes in mean ΔPtcCO2 versus changes in REM-sleep percentage of TST. Each subject (N = 26) is represented by a colored figure according to group (legend in panel). Mean PtcCO2 in group 1 (median (IQR) 0.26 (0.28) kPa) differed significantly from group 3 (−0.20 (0.23) kPa, P < 0.0005), but not from group 2 (0.11(0.10) kPa, P = 0.027). The change in REM percentage of TST was significantly different between groups 1 and 2 (median (IQR) = −4.5 (6.9) % versus 3.9 (8.9) %, P = 0.001). Change in mean ΔP tc CO 2 is the difference in the mean increase in transcutaneous carbon dioxide pressure between alcohol and control sleep. Change in mean REM % of TST is the difference in the mean rapid eye movement sleep percent of total sleep time between alcohol and control sleep

