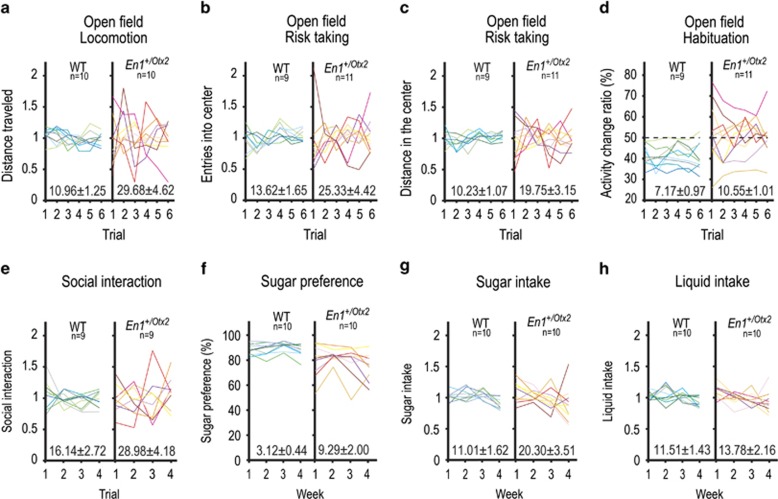
Figure 2.
En1+/Otx2 mutants show increased fluctuations in different behavioral paradigms. Individual animals are represented by different lines in the separate graphs for mutants and controls. CV±SE was calculated and shown above x axis of the graph of both genotypes. Animal activity was recorded for 1 h in the OFT for six consecutive trials over 3 weeks (a–d). En1+/Otx2 animals exhibited increased CV for (a) activity levels (t18=3.029, p=0.007), (b) the percentage of entries into the center (t18=2.482, p=0.028), and (c) the percentage of the total distance they traveled in the center (t18=2.864, p=0.014). CV for En1+/Otx2 mutants was also increased for (d) ACRs (t18=2.38, p=0.027). In the social interaction test, animals of the same genotype were recorded for 5 min in four consecutive trials over 2 weeks. Fluctuation in the time animals interacted was calculated for four trials, following one initial habituation trial. Mutants (e) showed an increased CV for the time they interacted (t16=2.572, p=0.020). Variance in sucrose preference was measured during the course of 4 weeks. As quantified by an increase in the CV, more fluctuations were observed in mutants over time for (f) sucrose preference (t18=3.017, p=0.007) and (g) sucrose intake (t18=2.398, p=0.028) but not for (h) total liquid intake (t18=0.879, p=0.391).

