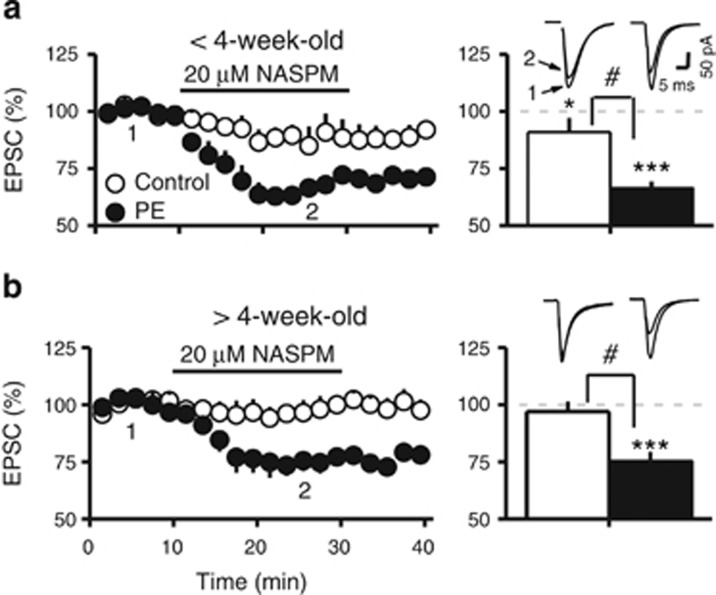
Figure 3.
Prenatal ethanol exposure enhances the depression of AMPAR-EPSCs induced by CP-AMPAR antagonist NASPM in VTA DA neurons. (a) Left panel is a summary graph of the effects of NASPM (20 μM) on AMPAR-EPSC amplitude (expressed as percentage of baseline) obtained in control (○) and PE (●) animals <4-week-old. Right panel depicts the significant depression in average amplitude of AMPAR-EPSCs during NASPM application in control (open bar) and PE animals (filled bar). Note that PE significantly enhanced the NASPM-induced depression of AMPAR-EPSCs. Sample AMPAR-EPSCs collected at the time points indicated by numbers in the left panel are depicting on top of the right panel. (b) The NASPM-induced depression on AMPAR-EPSCs persisted in PE animals >4-week-old. Left panel illustrates the effects of NASPM obtained in control (○) and PE (●) animals. Right panel is a summary graph of AMPAR-EPSCs measured during NASPM application. Note that NASPM reduced the amplitude of AMPAR-EPSCs only in PE animals. Sample EPSC traces are depicted on the top. #P<0.05, differences in NASPM-induced depression between control and PE animals; *P<0.05, ***P<0.001, differences in EPSC amplitude before and after NASPM (between points 1 and 2).

