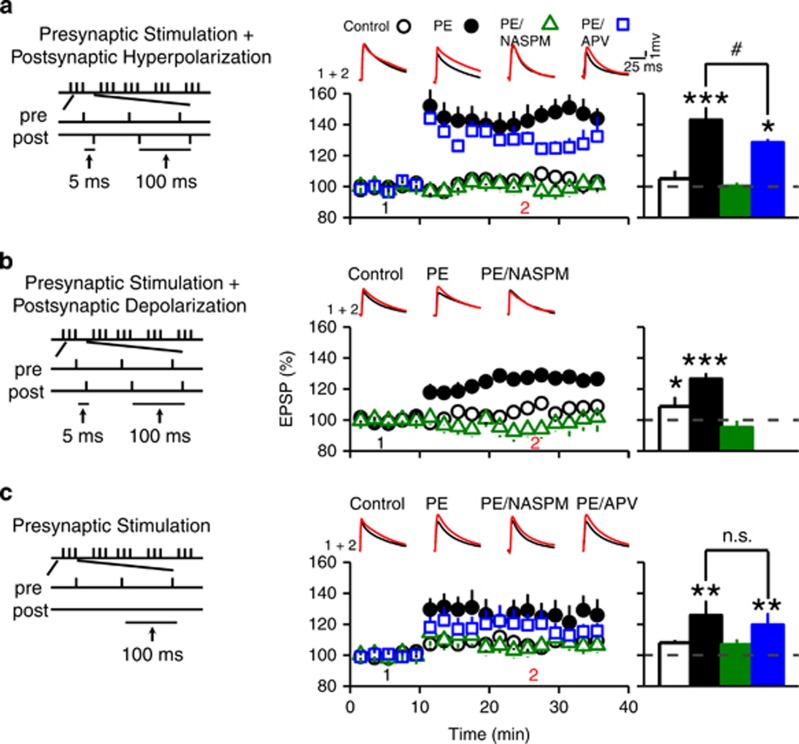
Figure 6.
Prenatal ethanol exposure promotes CP-AMPAR-dependent STD LTP in VTA DA neurons. (a) Prenatal ethanol exposure facilitates the induction of anti-Hebbian LTP in VTA DA neurons. Left panel depicts the stimulation protocol used for the induction of anti-Hebbian LTP (delivered every 5 s for 15 times). Middle panel depicts summary graphs of AMPAR-EPSP amplitude recorded before (time point 1) and after (time point 2) the induction protocol in control (○), PE animals (●), PE animals with NASPM (Δ), and PE animals with APV (□). Note that the pairing protocol elicited a profound LTP in PE but not in control animals. This anti-Hebbian LTP was blocked by the CP-AMPAR antagonist NASPM (20 μM), but not by the NMDAR antagonist APV (50 μM). However, APV decreased the magnitude of LTP in PE animals. Upper traces illustrate sample EPSP traces taken before and during LTP. Right panel depicts summary graph of the magnitude of LTP obtained in various conditions described in the middle panel. (b) Prenatal ethanol exposure enhances the STD LTP induced by pairing presynaptic stimulation with postsynaptic depolarization. Left panel depicts the stimulation protocol. Middle panel illustrates the magnitude and time course of STD LTP obtained in control (○), PE (●) animals, and PE animals with NASPM (Δ). Upper graph depicts sample EPSP traces. Right panel is a summary bar graph of average STD LTP magnitude. Note that PE significantly enhanced the magnitude of STD LTP, which was blocked by NASPM. A weak STD LTP was also observed in control rats. (c) Presynaptic stimulation alone was sufficient to induce LTP in PE animals. Left panel illustrates the stimulation protocol using only presynaptic stimulation. Middle panel depicts the magnitude and time course of the LTP in control animals (○), PE animals (●), PE animals with NASPM (Δ), and PE animals with APV (□). In PE animals, LTP induction was abolished by NASPM but not by APV. Upper panel depicts sample EPSP traces. Right graph is a summary of LTP magnitude in conditions depicted in the middle panel. *P<0.05; ***P<0.001, differences before and after the stimulation protocol; #P<0.05, differences between PE and PE with APV treatment; n.s., no significant differences.

