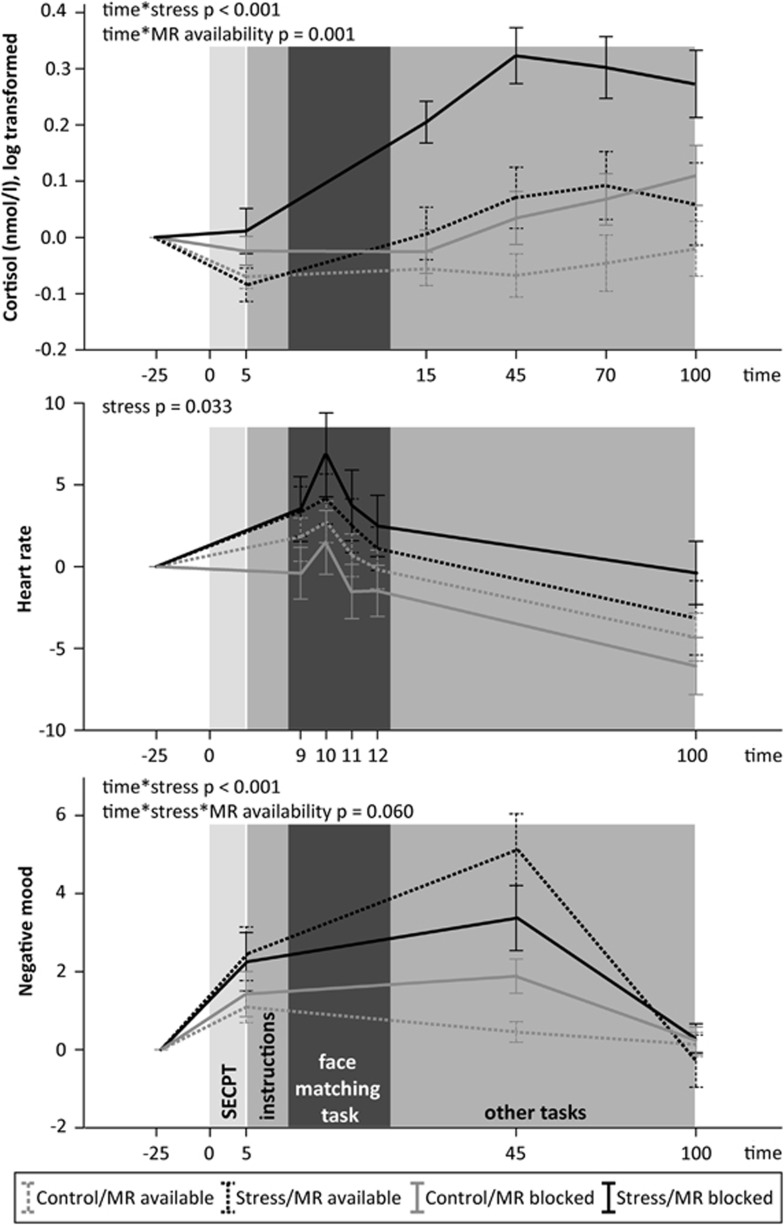
Figure 1.
Stress measurements over the course of the experiment. Participants arrived and were randomly assigned to one of four groups: control/MR-available, stress/MR-available, control/MR-blocked, stress/MR-blocked. After drug or placebo ingestion and habituation to the laboratory environment, participants entered the MRI room and underwent either a stress induction or a control procedure. This was immediately followed by the emotional face-matching task during, which fMRI data were acquired for subsequent connectivity analyses. The figure shows cortisol levels (top), heart rate (middle), and negative mood (bottom) for all experimental groups over the course of the experiment. Time is indicated in minutes after stress induction. All measurements were baseline corrected to the last measurement during habituation (−25 min). Light gray-shaded areas indicate stress induction (or non-stressful control procedure), intermediate gray-shaded areas indicate the time of fMRI scanning, dark gray-shaded area indicates the emotional face-matching task. SECPT, socially evaluated cold pressure task. Mean values are depicted, error bars represent 1 SEM.

