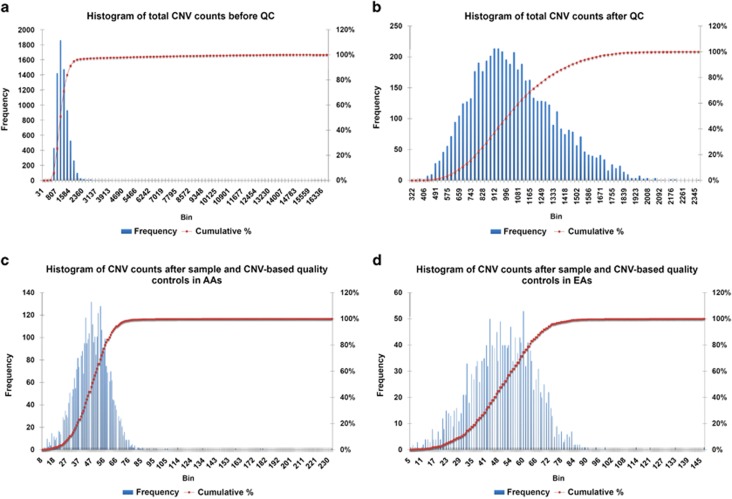
Figure 1.
(a, b) Distributions of the CNV counts per sample before and after sample-based quality control, respectively. The merged CNV calls are used. (c, d) Distributions of the CNV counts per sample after both sample- and CNV-based quality controls in AAs and EAs, respectively. The modal numbers were 46 (8–231) with a mean of 46±14 in AAs (c) and 59 (5–145) with a mean of 49±16 in EAs (d).

