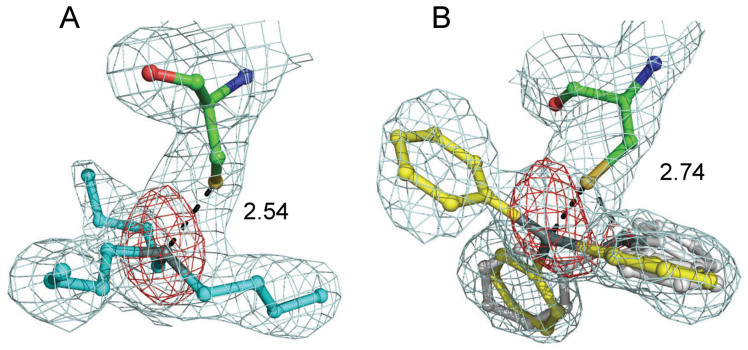
Figure 2. The organotins ((A): TBT, (B): TPT) and Cys285 in the ligand-binding pocket of PPARγ.
Anomalous difference electron density maps contoured at 3.5σ (red) indicate the position of the tin atom and omit 2FO–FC electron density maps contoured at 0.5σ (cyan) indicate the geometry of the aliphatic or aromatic chain. Distances between the tin and sulfur atoms are indicated. In panel (B), the major and minor conformations of TPT are shown in yellow and gray, respectively.

