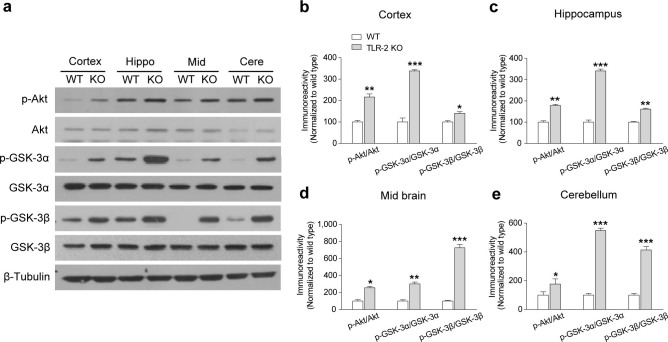
Figure 4. The levels of phosphorylated Akt and GSK-3 are spontaneously increased in TLR-2 KO mice.
(a) Immunoblots of selected brain regions, including cerebral cortex, hippocampus (Hippo), midbrain (Mid), and cerebellum (Cere), of WT and TLR-2 KO mice. Quantitative analysis of immunoblots showed that the levels of p-Akt, p-GSK-3α, and p-GSK-3β were significantly higher in the cerebral cortex (b), hippocampus (c), midbrain (d), or cerebellum (e) region of TLR-2 KO mice compared to WT mice (n = 3 per each group). The gels have been run under the same experimental conditions. All data are shown the mean ± s.e.m. *P < 0.05, **P < 0.01, ***P < 0.001 vs. WT mice.

