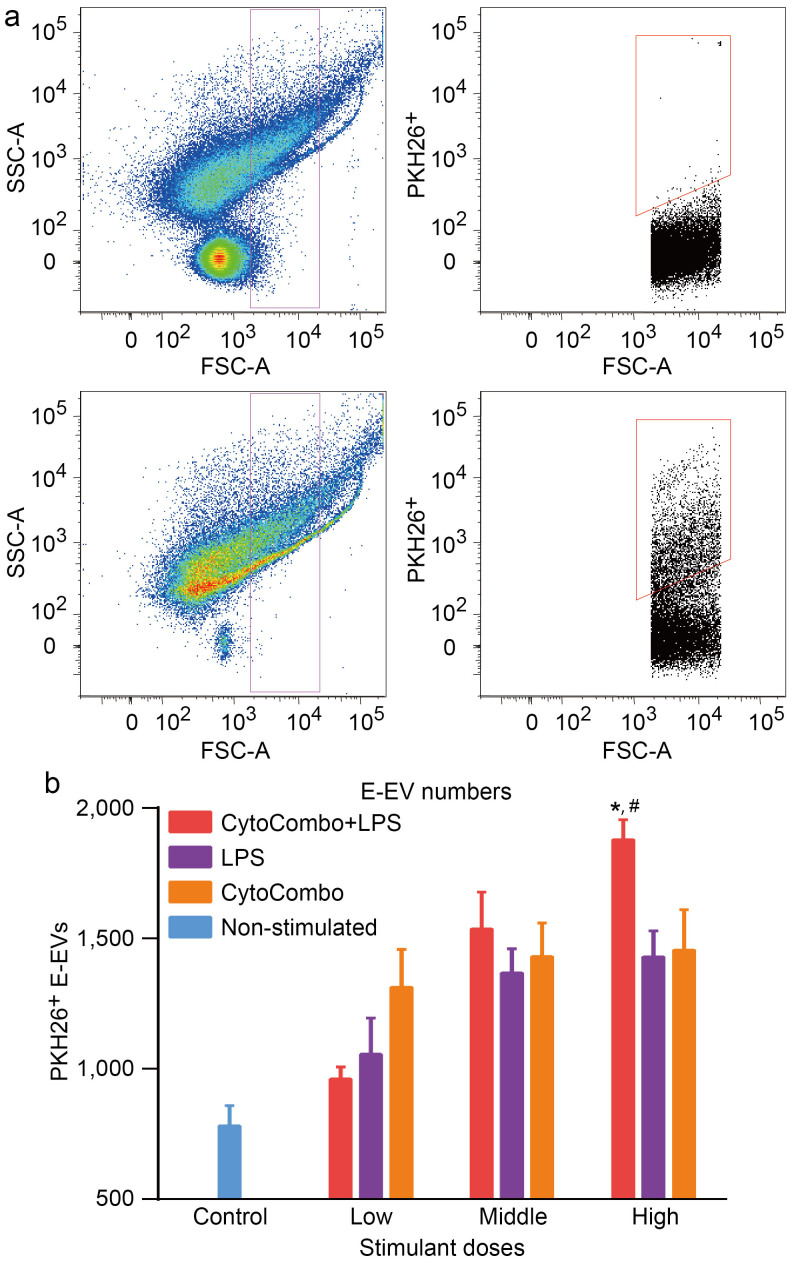
Figure 3. Quantitative analysis of E-EVs by flow cytometry.
(a) PKH26-positive E-EVs were detected and measured quantitatively by flow cytometry. The upper graphs show the pre-culture medium with CytoCombo + LPS. The lower graphs show the culture medium from b.End5 cells stained with PKH26 stimulated by CytoCombo + LPS for 3 hours. Vesicles gated from submicron to micron size (0.3 μm to 3.0 μm in diameter, magenta) are shown in the graph on the left. In the graphs on the right, PKH26-positive E-EVs are gated (red). The pre-culture medium contains many FBS-derived vesicles that are negative for PKH26. E-EVs can be observed in the 3-hour culture medium as the PKH26-positive fraction. (b) E-EV production is significantly upregulated after 3 hours of exposure to the high dose of CytoCombo + LPS. In contrast, a lower number of E-EVs are observed in the LPS and CytoCombo groups (reported as the number of PKH26-positive E-EVs in 100 μL of medium, n = 4 for each). Non-stimulated control indicates basal production level of E-EVs. * P < 0.05, CytoCombo + LPS vs. LPS; #P < 0.05, CytoCombo + LPS vs. CytoCombo.

