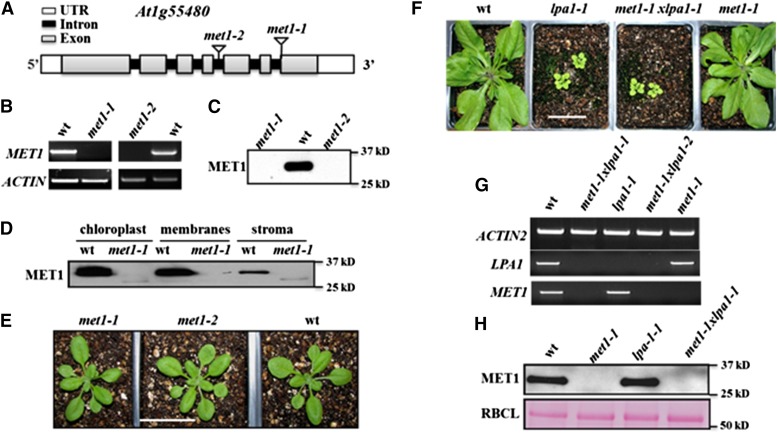
Figure 3.
Reverse Genetic Analysis of Null Mutants in MET1, Chloroplast Localization of MET1, and Effects on Protein and mRNA Levels in Arabidopsis.
(A) Gene model structures and positions of T-DNA insertions in the met1-1 and met1-2 alleles. Exons (gray), introns (black), and 5′ and 3′ untranslated regions (white) are indicated.
(B) met1-1 and met1-2 lines do not accumulate detectable MET1 transcript, as determined by RT-PCR (35 cycles). ACTIN2 was used to normalize MET1 mRNA.
(C) met1-1 and met1-2 do not accumulate detectable MET1 protein. Total protein was extracted from rosette leaves of wild-type and mutant plants. Twenty micrograms of protein was loaded in each lane.
(D) MET1 is primarily located in chloroplast membrane fractions but is absent in met1-1 and met1-2. Total chloroplast, chloroplast membranes, and stroma were used for immunoblotting with MET1 antiserum.
(E) Representative images of 16-d-old wild-type, met1-1, and met1-2 lines grown at 80 μmol photons m−2 s−1 under a 14-h-light/10-h-dark cycle. Older plants (23 d) grown under these conditions and plants (16 and 23 d) grown at similar light intensities at a 18-h-light/6-h-dark cycle are shown in Supplemental Figures 4A and 4B. Bar = 3 cm
(F) Phenotypes of 4-week-old wild-type, lpa1-1, met1-1, and met1-1x lpa-1 grown at 80 μmol photons m−2 s−1 under a 14-h-light/10-h-dark cycle. Additional images for plants grown under an 18-h-light/6-h-dark cycle are shown in Supplemental Figure 5. Bar = 3 cm
(G) mRNA analysis of MET1 and LPA1 in the wild type and single and double mutants of LPA1 and MET1. ACTIN2 is shown as internal reference.
(H) Immunoblot analysis of MET1 in the wild type and single and double mutants of LPA1 and MET1 (upper panel). A Ponceau stain of the RBCL region of the blot is shown as a loading control (lower panel).

