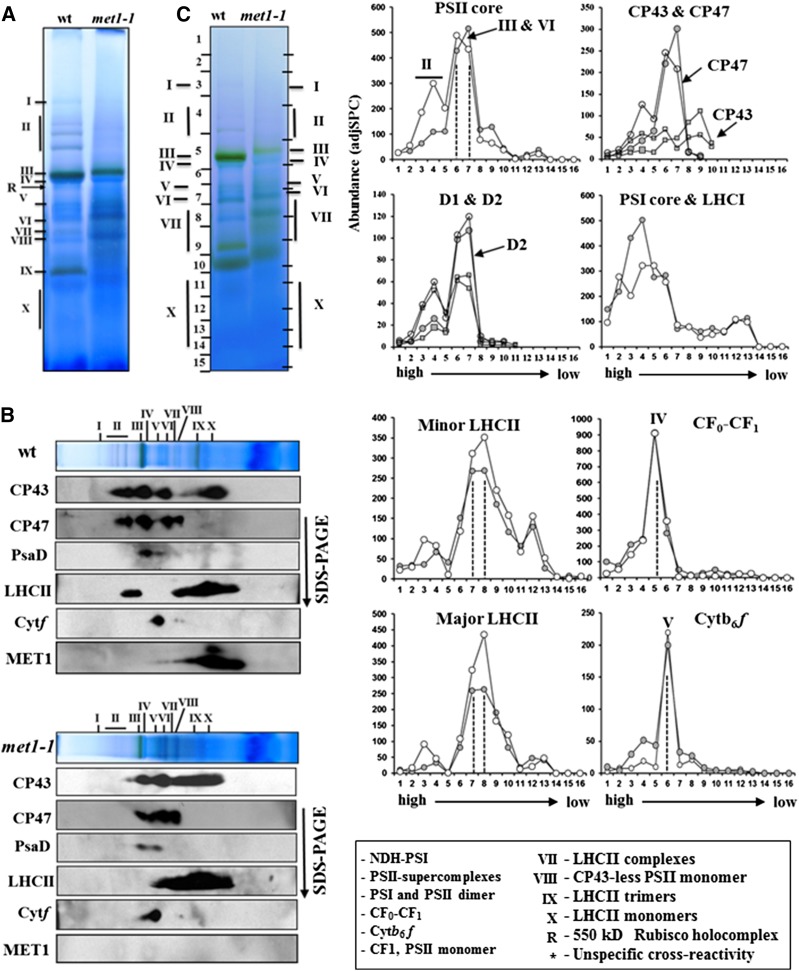
Figure 7.
The Oligomeric State of the Thylakoid Membrane Complexes of 20-d-Old Wild-Type and met1-1 Plants Grown under Fluctuating Light Intensity.
(A) BN-PAGE of DM-solubilized thylakoid membrane protein complexes in the wild type and met1-1, followed by staining with Coomassie blue. Proteins and protein complexes in the gel lanes were identified and quantified by immunoblotting (B) and MS/MS ([C]; Supplemental Data Set 3). Annotation of the protein complexes (I-X) is as in Figure 5. An equal amount of chlorophyll (10 μg) was loaded in each lane.
(B) Immunoblotting of two-dimensional BN-PAGE-SDS-PAGE gels of the wild type and met1-1 DM-solubilized thylakoids probed with antisera against the D1 protein, CP43, CP47, Cyt f, PsaD, LHCII-1, and MET1. Individual lanes from BN-PAGE gels (as in [A]) were excised and solubilized in SDS, and proteins were separated by SDS-PAGE, blotted, and immunodetected.
(C) Protein abundance accumulation profiles in the BN-PAGE gel of the wild type and met1-1 (as in [A]) determined by MS/MS analysis (see data in Supplemental Data Set 3). The y axis shows protein abundance based on the number of matched AdjSPC. Fraction numbers (x axis) correspond to the gel regions (gel slices processed for MSMS analysis) in (A). Note that the gel slices were cut to accommodate for differential mobility in the wild-type and met1-1 lane as indicated on the sides of the BN-PAGE gel lanes. Open circles represent the wild type, and closed circles represent the mutant.

