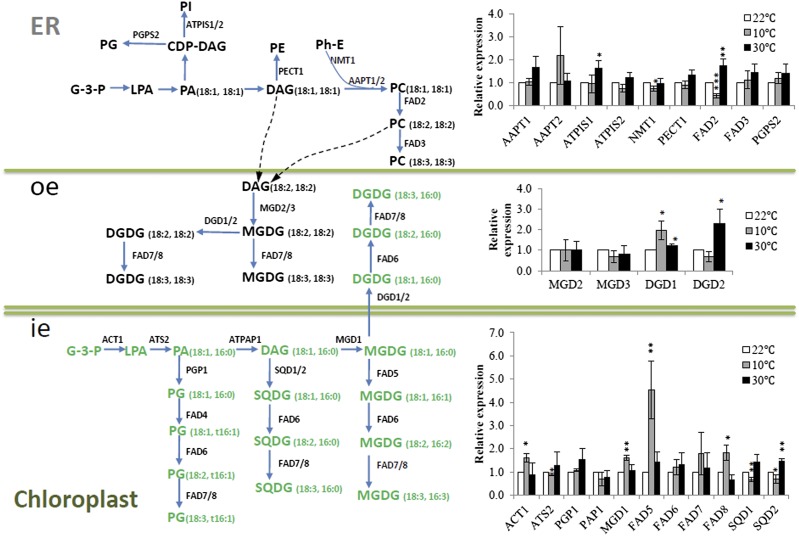
Figure 2.
Glycerolipid Pathway Coordination at the Transcript Level.
Lipid species are generated through either the eukaryotic (sn-1/sn-2, C18/C18 or C16/C18) or the prokaryotic pathway (sn-1/sn-2, C18/C16). Dashed lines represent possible channeling between the ER and chloroplast (Benning, 2009). Relative expression levels of selected genes were analyzed by real-time qRT-PCR using cDNA from Arabidopsis grown at 22°C (white bar), 10°C (gray bar), and 30°C (black bar) as templates. For comparison, expression values from plants grown at 22°C were normalized to 1 using StepOne software 2.0 (Applied Biosystems). Relative expression values (means ± sd, n = 3) from low- and high-temperature-treated plants were presented as fold change against plants grown at 22°C. *P value < 0.05; **P value < 0.01 (two-tailed Student’s t test) compared with values for control (plants grown at 22°C). ie, inner envelope; oe, outer envelope.

