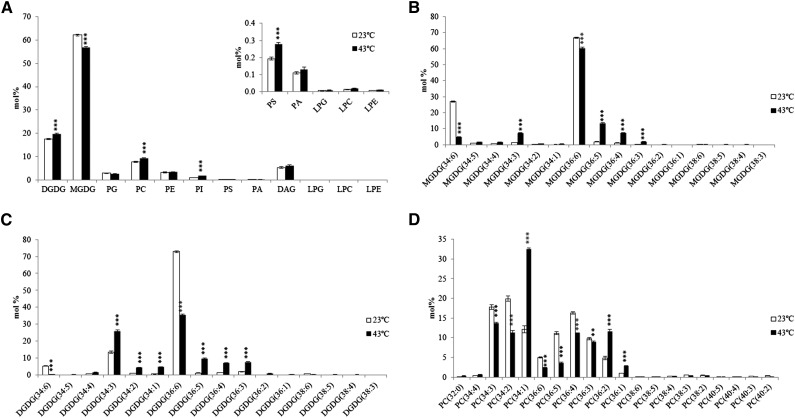
Figure 4.
ESI-MS/MS Analysis of Glycerolipid Species in Leaves of in A. lentiformis Grown at 23°C and 43°C.
(A) Mol % of different lipid species in leaves of A. lentiformis grown at 23°C and 43°C.
(B) to (D) Molecular species of MGDG (B), DGDG (C), and PC (D) (mol %) in leaves of A. lentiformis grown at 23°C and 43°C. Detailed molecular compositions of all lipid species are available in Supplemental Data Set 1. Values are means ± sd (n = 5). *P < 0.05; **P < 0.01; ***P < 0.001.

