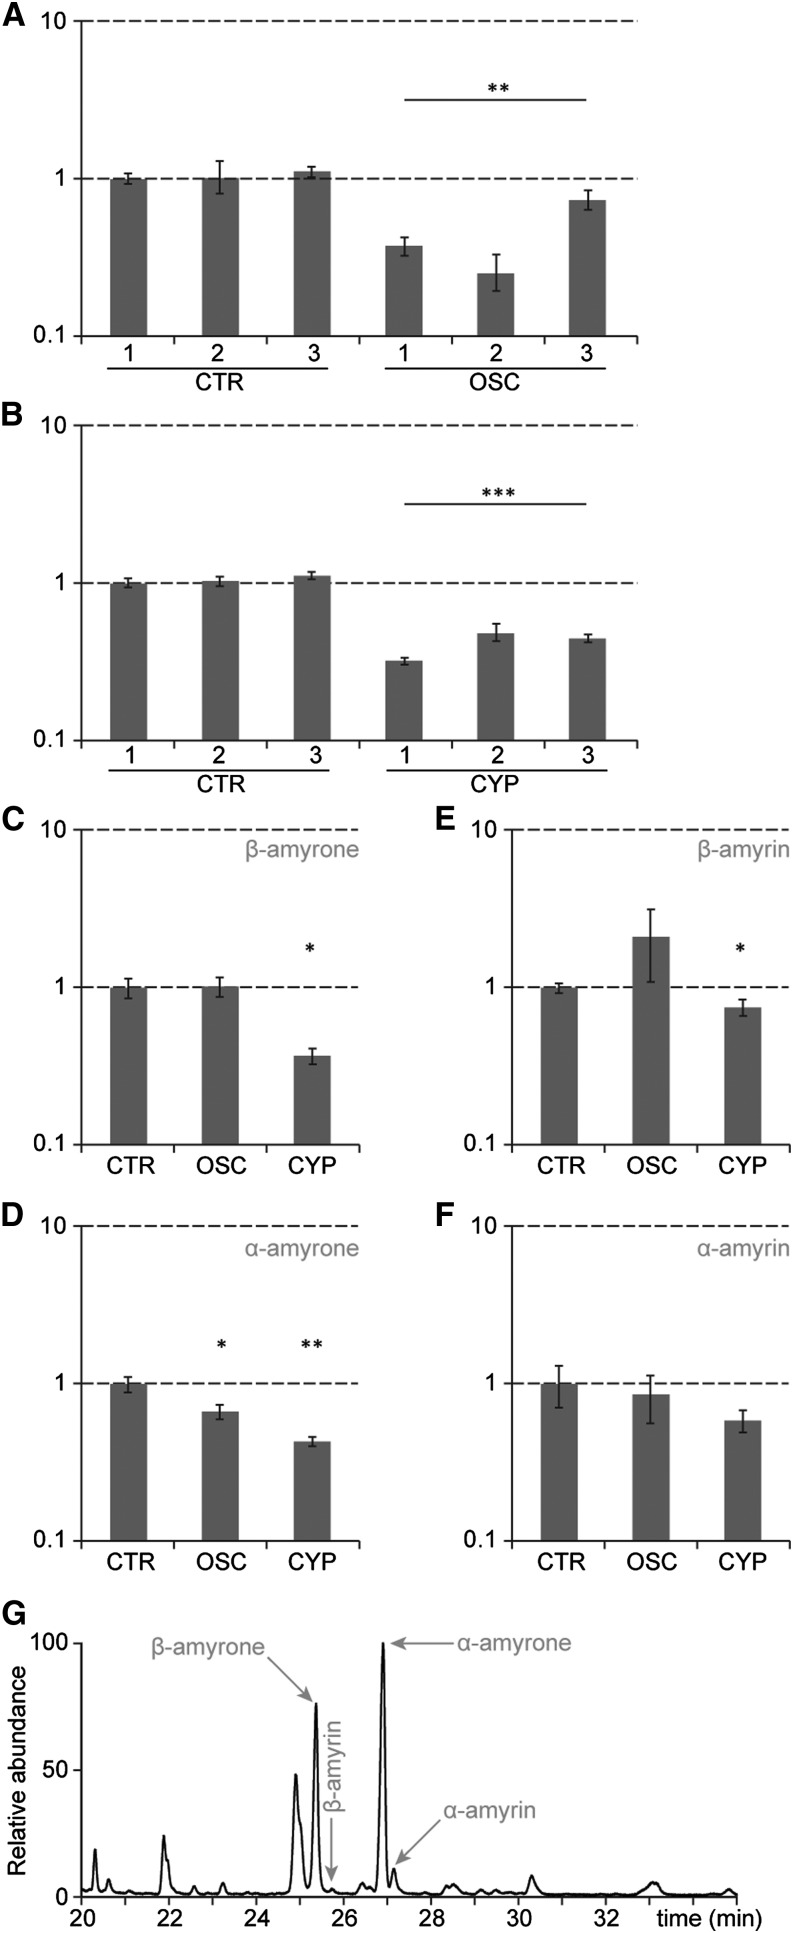
Figure 7.
Silencing of OSC2 and CYP716A14v2 in Transgenic A. annua Plants.
(A) and (B) qPCR analysis of transgenic A. annua plants revealed silencing of OSC2 (OSC) (A) and CYP716A14v2 (CYP) (B). Control plants (CTR) were transgenic plants transformed with a nonfunctional β-glucuronidase construct. The y axis is the expression ratio relative to the normalized transcript levels of CTR line 1 in log scale.
(C) to (F) GC-MS analysis revealed altered metabolite levels in transgenic A. annua plants. The amounts of β-amyrone (C), α-amyrone (D), β-amyrin (E), and α-amyrin (F) in OSC2 (OSC) and CYP716A14v2 (CYP) silenced lines relative to the amounts in the control (CTR) lines are plotted. Error bars are se of mean for n = 3. Statistical significance was determined by Student’s t test (*P ≤ 0.1; **P ≤ 0.01; ***P ≤ 0.001).
(G) GC chromatogram of the A. annua cultivar used for silencing, showing it mainly accumulates β-amyrone and α-amyrone and only trace amounts of β-amyrin and α-amyrin.

