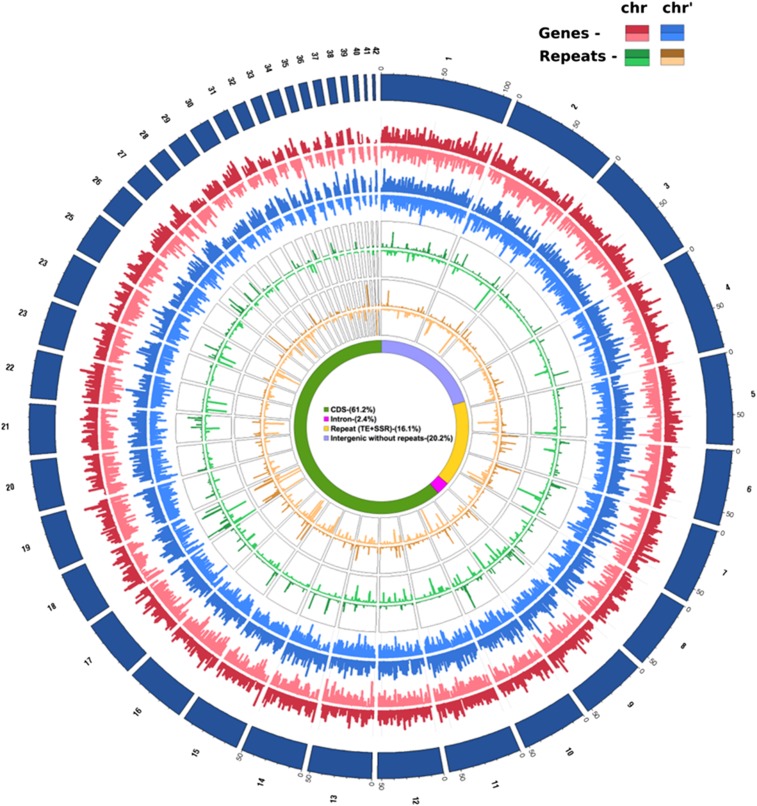
Figure 1.
Circular View of the Genomic Landscape of F. solaris JPCC DA0580.
Forty-two chromosome pairs are represented with genes (red for positive strand and light red for negative strand) and repeat elements (green for positive strand and light green for negative strand). The chromosome numbers (black) are marked on the outermost circle (dark blue). Within each chromosome pair, the chromosome with higher GC content is defined as chrX (X is the chromosome number) and the other as chrX′. The inner four tracks (blue and orange) of genes and repeats are for the second pair of 42 chromosomes. The innermost circle is a pie chart showing the percentage of each genomic feature in diploid genome coverage.

