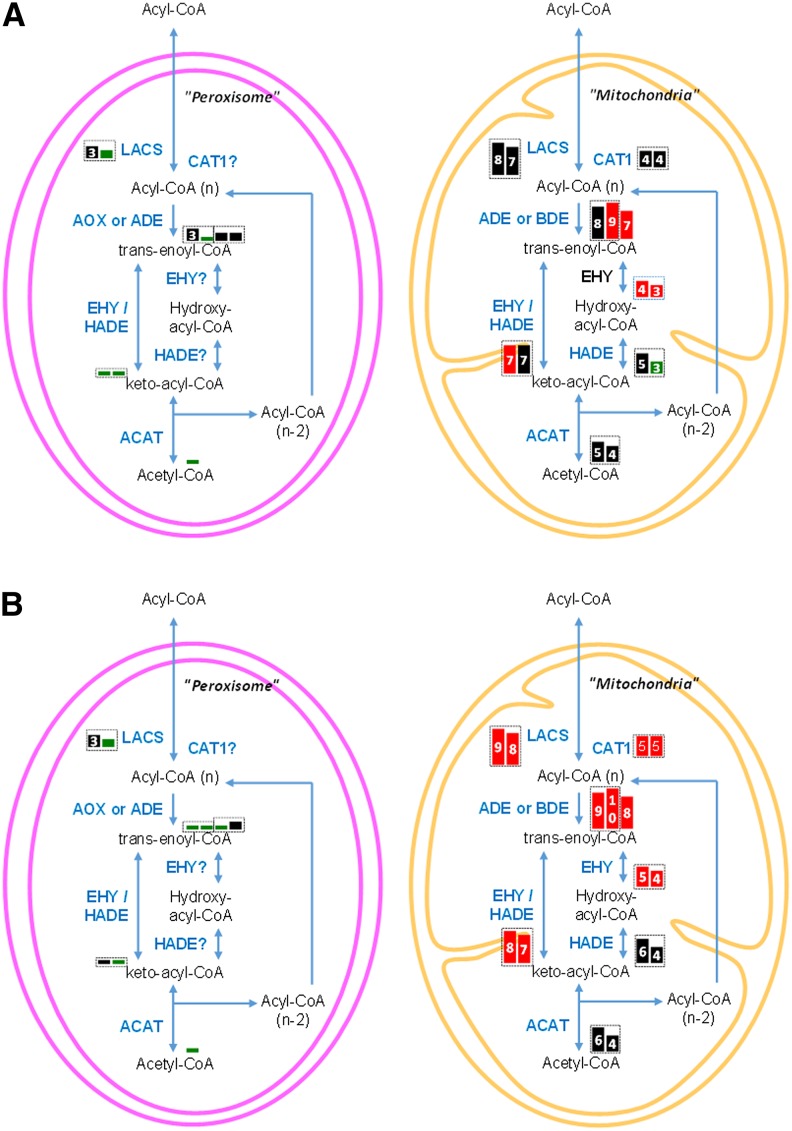
Figure 6.
Expression of Genes Encoding Fatty Acid Degradation Pathway Components in F. solaris JPCC DA0580.
The 96-h (A) and 144-h (B) culture. Each box represents an isoform. Box sizes and numbers represent magnitudes of RPKM values [3: (8)∼16, 4: ∼32, 5: ∼64, 6: ∼128, 7: ∼256, 8: ∼512, 9: ∼1024, 10: 1024∼]. Red, black, and green boxes represent log2 fold changes in RPKM values (96 h/48 h or 144 h/48 h) >1, ≤−1 to 1, and <−1, respectively. The enzymes that are not predicted to localize in the subcellular compartments are marked by question marks. The homoeologous gene pairs are surrounded by dashed boxes.

