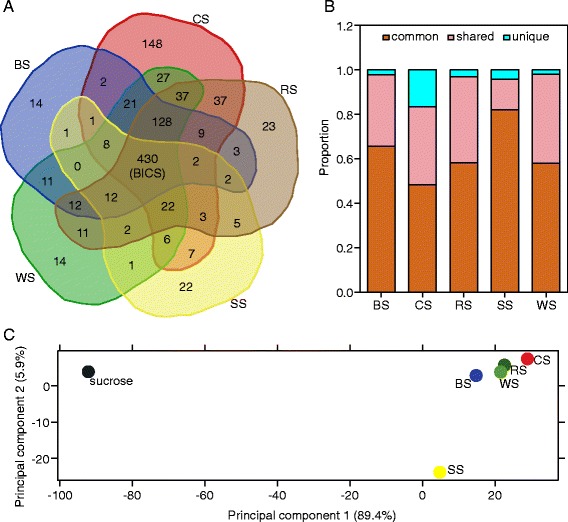
Figure 4.

Overview of Neurospora crassa transcriptome induced by five crop residues. BICS, biomass commonly induced core set; BS, barley straw; CS, corn straw; RS, rice straw; SS, soybean straw; WS, wheat straw. (A) Venn diagram of genes upregulated by each crop straw. (B) Proportions of genes upregulated by each crop straw. “Common” represents genes induced by all five straws; “shared” represents genes induced by at least two but not all straws; “unique” represents genes uniquely induced by one crop residue. (C) Principal component analysis of transcription profiling data performed by DESeq. The RNA-Seq reads of N. crassa grown on sucrose, BS, CS, RS, SS, and WS were used for the principal component plot. Each point on the graph represents one biological sample. Proportions of the principal components 1 and 2 are shown in brackets.
