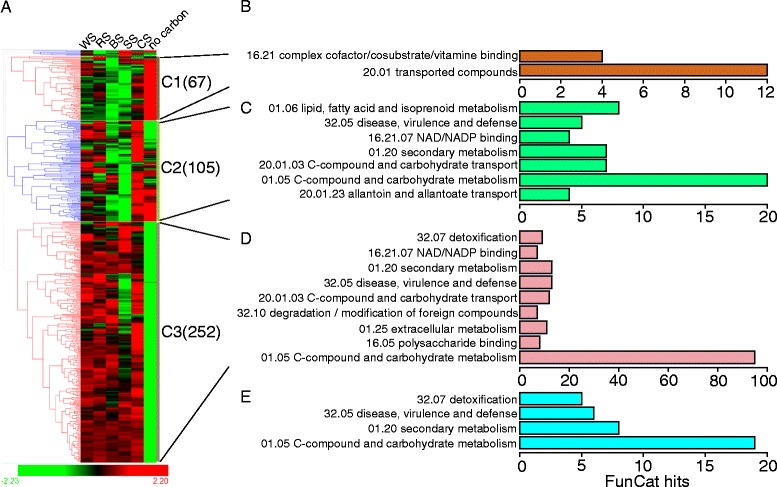
Figure 5.

Hierarchical clustering and functional category analysis of 430-gene biomass commonly induced core set (BICS). BS, barley straw; C1, cluster 1; C2, cluster 2; C3, cluster 3; CS, corn straw; RS, rice straw; SS, soybean straw; WS, wheat straw. (A) Hierarchical clustering analysis of log2 fold changes in each crop residue versus the sucrose condition. The gene numbers for each cluster are shown in brackets. “No carbon” data were derived from a reference [20]. (B–E) Functional category analysis [29] of C1, C2, C3 (biomass regulon, BR), and biomass unique set (BUS, including 88 genes) from C3 compared with three polysaccharide regulons (see Figure 6A), respectively. Categories with FunCat hits more than three and P value < 0.05 are shown.
