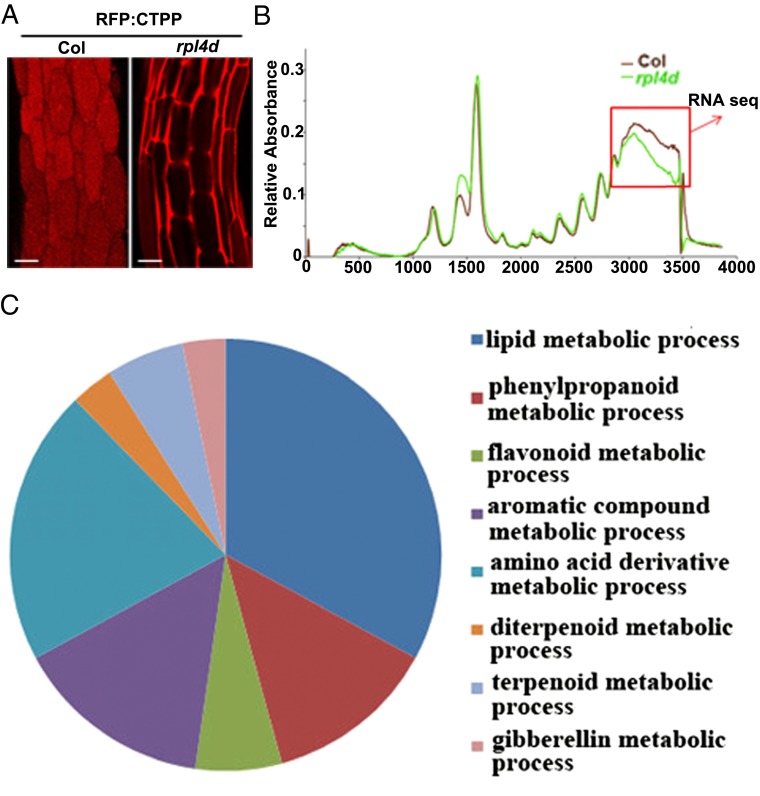
Fig. 1.
Lipid metabolism genes were translational down-regulated in rpl4d mutants. (A) Images of hypocotyl cells from RFP:CTPP lines in the background of Col or rpl4d mutant. (Scale bars, 10 μm.) (B) A254 absorption profiles of total polysomes from 7-d-old seedlings of Col and rpl4d mutants. Larger fraction numbers correspond to higher sucrose concentrations. Red frame indicates sucrose gradient corresponding to polysome bound mRNA. Image of the polysome profile was modified from figure 3B in ref. 48 and used in the current study. (C) Metabolism catalogs of pathways according to GO classification.

