
Fig. 2.
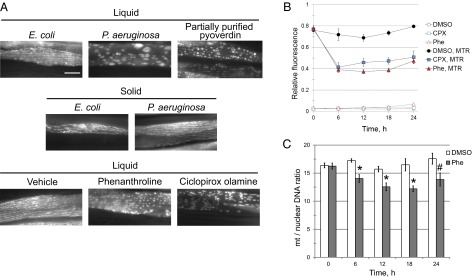
Pyoverdin disrupts mitochondrial homeostasis and triggers mitochondrial turnover. (A) Fluorescence microscopy of worms with mtGFP exposed to E. coli, P. aeruginosa, or partially purified pyoverdin in liquid; E. coli or P. aeruginosa on plates; or vehicle (DMSO), Phe (1 mM), or the iron chelator ciclopirox olamine (CPX; 1 mM) in liquid. (B) Flow vermimetry of worms exposed to Phe (1 mM), CPX (1 mM), or DMSO and labeled with MTR (4.375 μM). Fluorescence was normalized to worm size. (C) Ratio of mitochondrial to nuclear genomes for worms treated with Phe or DMSO. Three biological replicates were performed; n = 5,000 (B) or 6,000 (C) for each biological replicate. Error bars represent SEM. *P < 0.01, #P < 0.05, Student’s t test. (Scale bar: A, 20 μM.)