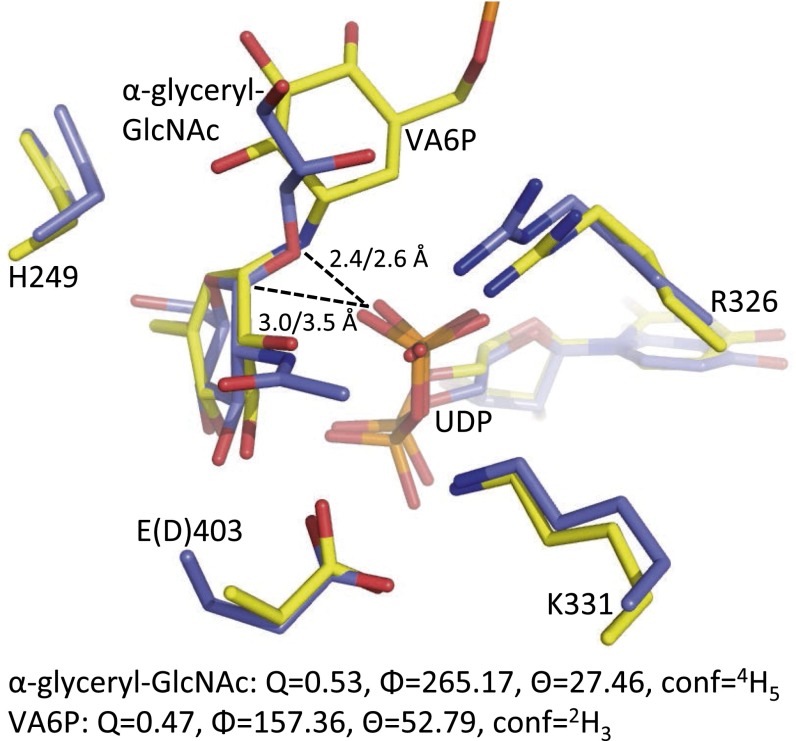
Fig. 5.
Comparison of TarM and OtsA ternary complexes. TarM (blue) in complex with UDP and enzyme catalyzed α-glyceryl-GlcNAc is superimposed with OtsA (yellow) in complex with UDP and bisubstrate inhibitor VA6P. Residues are displayed in stick form and colored according to heteroatom type. The UDP leaving group phosphate O3B to glycosidic O/N (TarM/OtsA) or anomeric carbon distances are labeled. Residues are identified according to TarM numbering and residue differences denoted in parenthesis. Cremer–Pople parameters for ring conformation are shown below.

