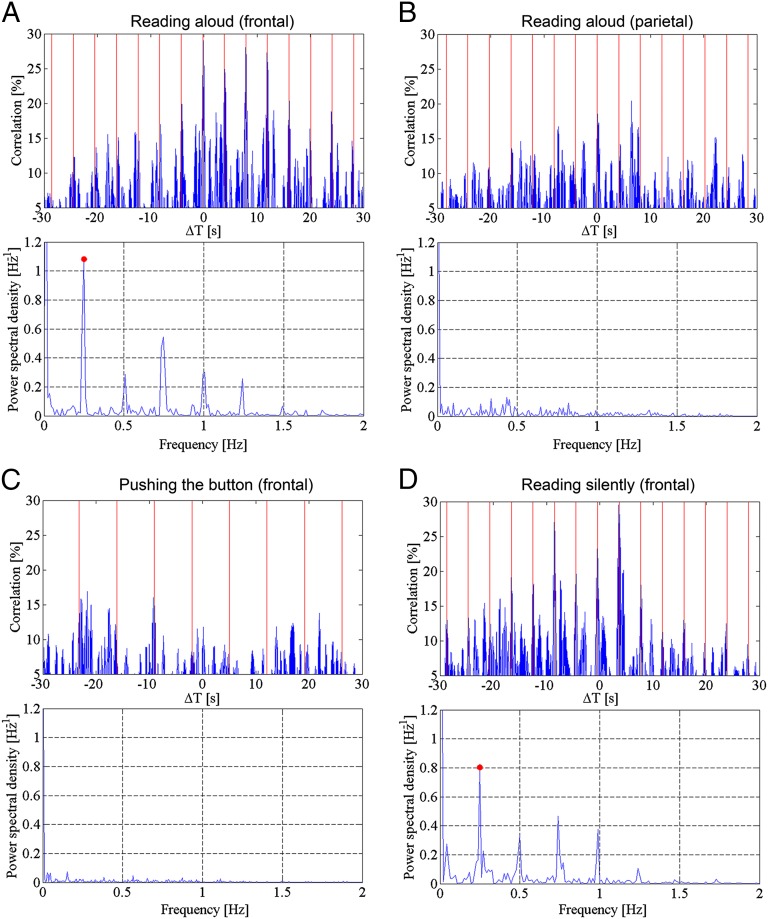
Fig. 2.
(A) Diagram showing the evolution of cross-correlation between the ECoG recorded by one electrode in Broca’s area where speech arrest was obtained during stimulation and the envelope of the corresponding audio signal; both traces were recorded while the patient was reading 18 different utterances aloud. The red vertical lines indicate the time of presentation of the linguistic items (every 4 s). The peaks of cross-correlation follow speech modulations over a period of 72 s. The periodogram, shown in the lower diagram, demonstrates a main frequency of increase of the correlation (red dot) of 0.25 Hz corresponding to a 4-s period, which is equal to the pace of the presentation. The lower peaks correspond to signal harmonics. Audio band, 2,750–3,250 Hz; ECoG band, 2–4 Hz. (B) Same as in A, but here, the ECoG was recorded by an electrode located in the superior parietal gyrus. The patient was reading aloud the same utterances as in A. Cross-correlation peaks do not follow speech modulations over a period of 60 s. As in A, the thin vertical lines indicate the time of presentation of the linguistic items (4 s). The periodogram here confirms the absence of any dominant frequency of change of the correlation compatible with the pace of presentation of the linguistics items. (C) Same as in A: electrode located over Broca’s area as in A, but the ECoG was recorded while the patient pushed a button with the hand contralateral to the operated dominant hemisphere each time she or he saw a slide showing the drawing of a finger pushing a button. The patient was asked to remain silent and to try to concentrate on the visual image without thinking verbally. The sound track was recorded in a previous trial during the same neurosurgical operation, when the same patient was reading aloud words and sentences. The frequency of the slide presentation in both trials was 7 s and is indicated by the red vertical lines. Changes in the cross-correlation are not following the pace of slide presentation and patient activity for a period of 70 s. As in B, the corresponding periodogram represented here does not show any specific or dominant frequency of the correlation compatible with the pace of stimulus presentation. (D) Same patient, same pace of presentation of the linguistic items, and same electrode as in A, but here the patient reads mentally 12 of the sentences he previously read aloud. The trace represents a period of 50 s read in a completely silent mode. Variations in cross-correlation between the ECoG recorded while the patient was reading mentally and the envelope of the audio recorded in a previous trial when the patient was reading aloud the same linguistic items, follow the presentation time (4 s) of the linguistic items (red vertical lines). The periodogram below shows a dominant frequency of variations of the correlation of 0.25 Hz (red dot), corresponding to a period of 4 s that, as in A, equals the rate of presentation of the linguistic items.

