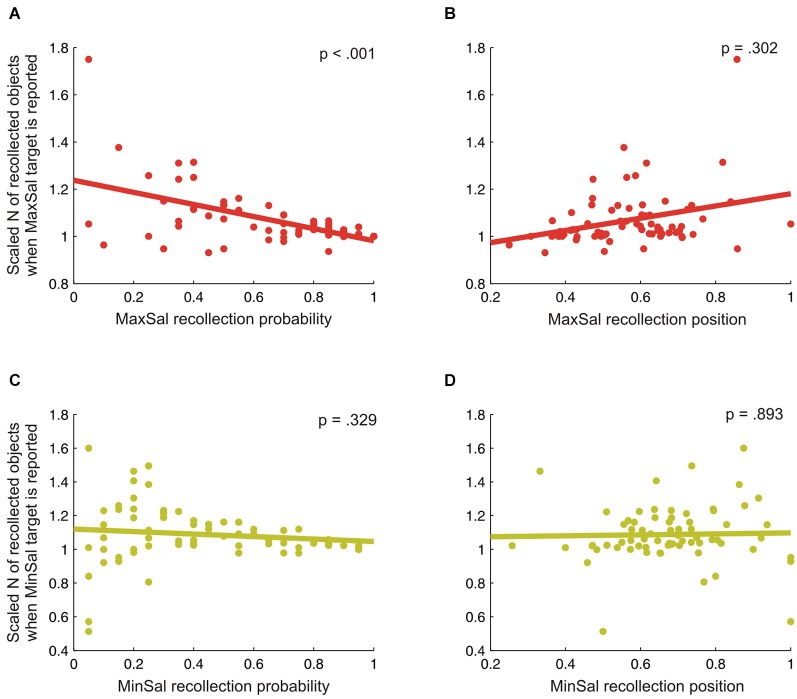
Figure 3.
Scaled amount (N) of recollected objects when the maximal (panels A and B) or the minimal-saliency target (panels C and D) was successfully reported as a function of either the recollection probability (panels A and C) or the recollection position (B and D) of the target. Overall, these graphs indicate that the probability to have successfully recollected the maximal-saliency (MaxSal) object reduced the overall amount of recollected objects (cf. panel A).

