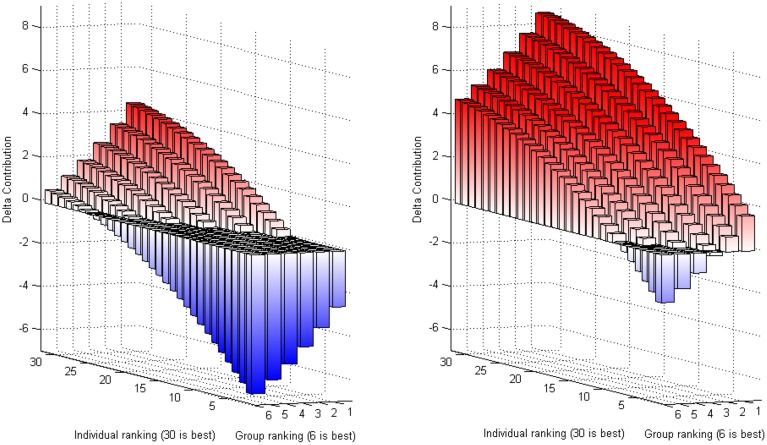
Figure 4.
Predicted change in contribution as a function of group and individual performance. The left and right panels correspond to the predicted difference in contribution under pseudocompetition and competition using results from columns (1) and (3) in Table 2, respectively. Red (resp. blue) bars correspond to a positive (negative) value of ΔContribution.

