
Figure 3.
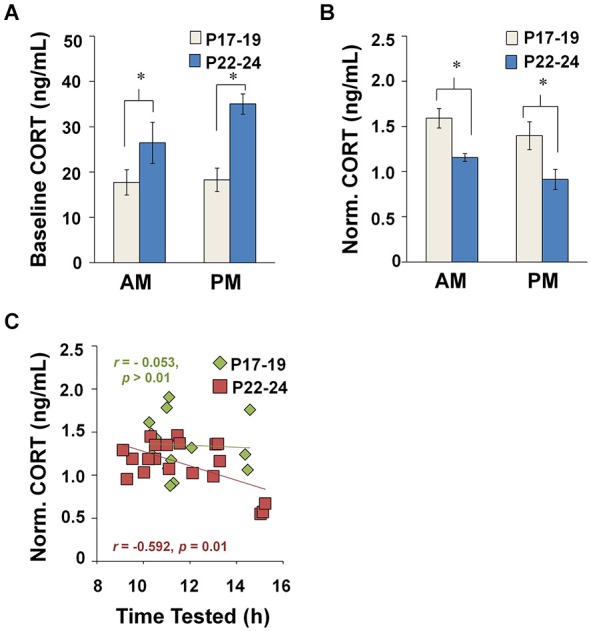
Plasma CORT concentrations measured at baseline and after EPM exposure. (A) Baseline CORT levels during diurnal AM and PM. 4–7 animals were represented in each TOD category per age group. (B) Impact of TOD and age on CORT levels in maze-exposed rats (P17–19: AM, n = 9; PM, n = 6; P22–24: AM, n = 13 and PM, n = 15). CORT concentrations were higher after testing at P17–19 compared to P22–24, regardless of whether tested during the AM (Tukey HSD: p = 0.012) or PM (Tukey HSD: p < 0.001). (C) CORT in maze-exposed rats plotted against time of testing. *p < 0.05.