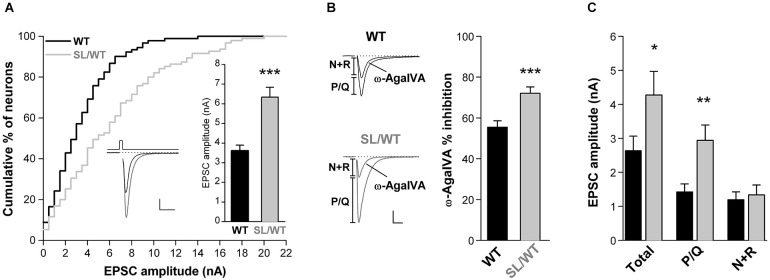
Figure 1.

Increased EPSC amplitude and increased contribution of P/Q-type Ca2+ channels to excitatory neurotransmission in cortical pyramidal cell autapses of SL/WT KI mice. (A) Cumulative distribution and average value (right inset) of EPSC amplitudes evoked in single WT and SL/WT cortical pyramidal cells in microculture for 10 to 14 days (DIV). EPSC amplitude: 6.3 ± 0.5 nA (n = 95) in SL/WT and 3.6 ± 0.3 nA (n = 91) in WT neurons (t-test: p = 5.0 × 10⁻⁶). Left inset: representative EPSC traces from a WT (black) and a SL/WT (gray) neuron; scale bars 10 ms, 1 nA. The relative number of neurons recorded from WT and KI mice at different DIV were closely matched, because EPSC amplitude continued to increase from 10 to 14 DIV in both control and SL/WT neurons (Tottene et al., 2009). (B) Contribution of P/Q-type Ca2+ channels to excitatory neurotransmission evaluated from the fraction of the EPSC inhibited by Aga (200 nM, a saturating concentration since the EPSC was not further inhibited by 400 nM Aga (Tottene et al., 2009)) in cortical pyramidal cells in microculture (DIV 8–12): 72 ± 3% (n = 19) in SL/WT and 56 ± 3% (n = 21) in WT neurons (t-test: p = 6.1 × 10⁻⁴). Representative EPSC traces before and after Aga are shown on the left; scale bars: 10 ms, 1 nA. The relative number of neurons recorded from WT and KI mice at different DIV were closely matched. (C) Average values of the amplitudes of the EPSC (total) and its Aga-sensitive (P/Q) and Aga-insensitive (N+R) components (same neurons as in B). The P/Q and N+R components for each cell were obtained (as shown in the representative traces in B) as difference of EPSC amplitude before and after Aga (P/Q) and the EPSC amplitude remaining after Aga (N+R). Values of EPSC amplitudes: 4.3 ± 0.7 in SL/WT vs. 2.6 ± 0.4 in WT (Total; t-test: p = 0.048); 2.9 ± 0.5 in SL/WT vs. 1.4 ± 0.2 in WT (P/Q; t-test: p = 0.0038); 1.3 ± 0.3 in SL/WT vs. 1.2 ± 0.2 in WT (N+R; t-test: p = 0.70).
