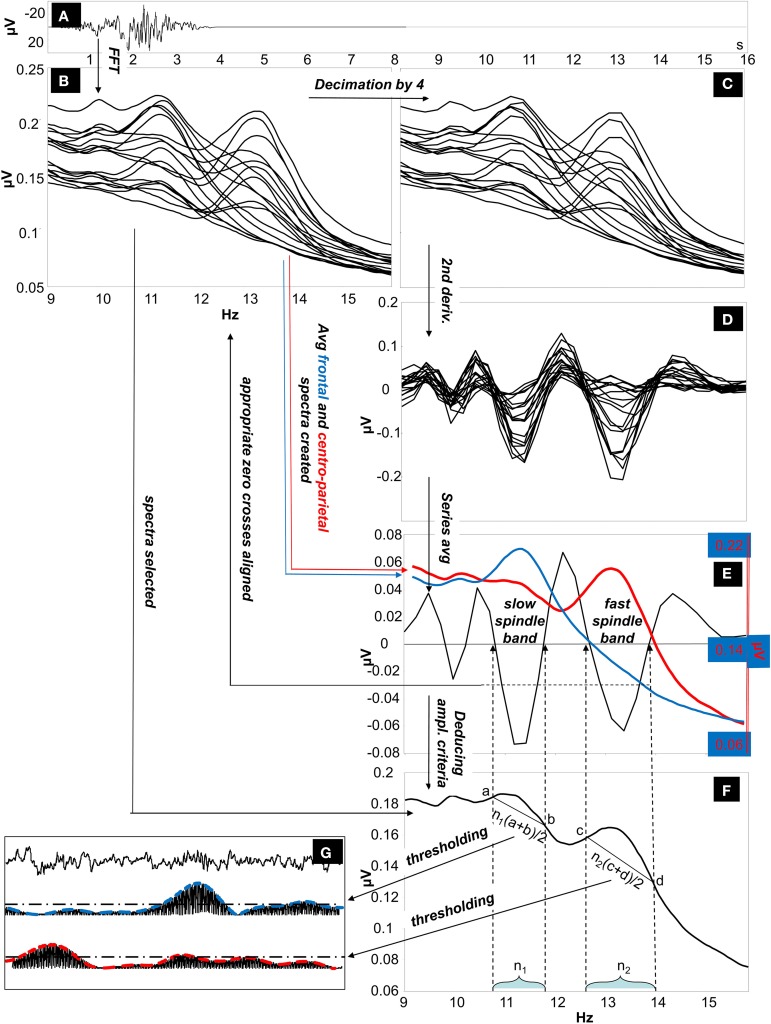
Figure 1.
The Individual Adjustment Method (IAM) of sleep spindle analysis. (A) Four-second EEG epoch Hanning-tapered and zero padded to 16 s. (B) Fast Fourier Transformation (FFT) is used to calculate 9–16 Hz average amplitude spectra of all night NREM sleep EEG from Hanning-tapered and zero-padded segments (derivations: Fp1, Fp2, F3, F4, Fz, F7, F8, T3, T4, T5, T6, C3, C4, Cz, P3, P4, O1, O2 referred to the mathematically-linked mastoids). (C) Amplitude spectra are decimated (down-sampled) by a factor of 4. (D) Second order derivatives of the decimated amplitude spectra. (E) Calculating the whole-scalp second order derivatives by averaging all series. The resulting average series is overplotted with the averaged frontal (Fp1, Fp2, F3, F4, Fz, F7, F8) and centro-parietal (C3, C4, Cz, P3, P4) amplitude spectra (the left-side Y axis is for average second-order derivatives, while the second Y axis on the right is for average amplitude spectra). Appropriate zero-crossing points encompassing individual-specific slow and fast sleep spindle bands are selected on the 9–16 Hz frequency scale. (F) Derivation-specific amplitude criteria are calculated. (G) Thresholding of the envelopes of the slow and fast-spindle filtered signal.

