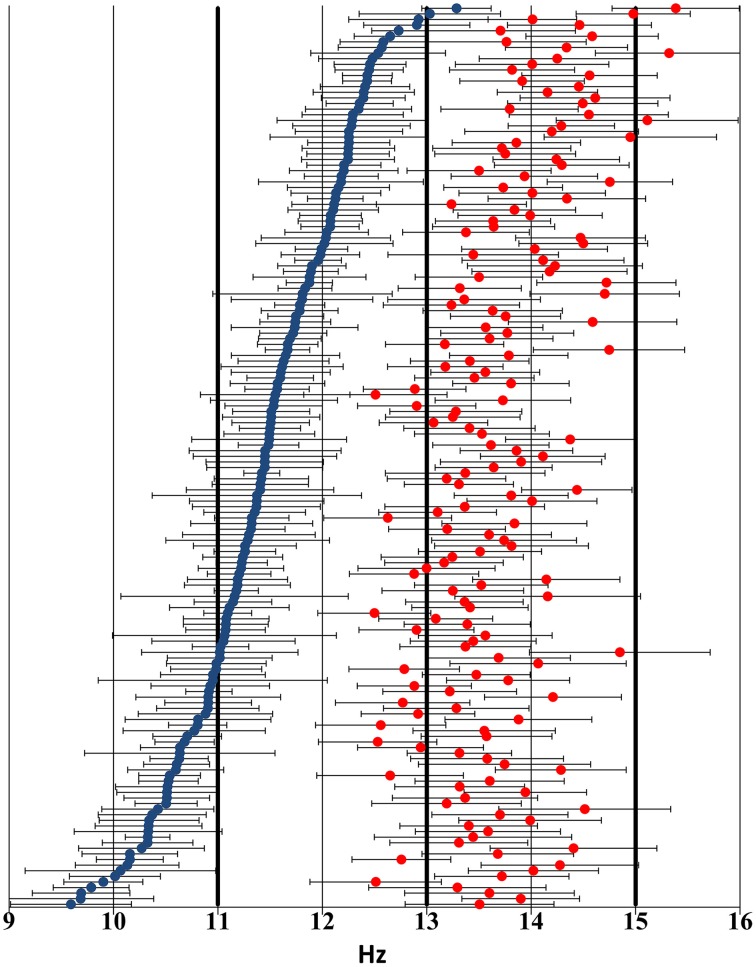
Figure 2.
Distribution of individual sleep spindle frequency bands across the 9–16 Hz frequency domain based on visual inspection of the sleep EEG spectrum and the zero crossings of the second-order derivatives thereof. Blue markers indicate slow spindle middle frequencies, while red markers show fast spindle middle frequencies. Negative and positive error bars illustrate lower and higher individual frequency limits, respectively. Thick lines highlight the 11 Hz, 13 Hz, and 15 Hz thresholds used in the FixF method. Subjects have been ordered by slow spindle middle frequency to ensure better visibility.

