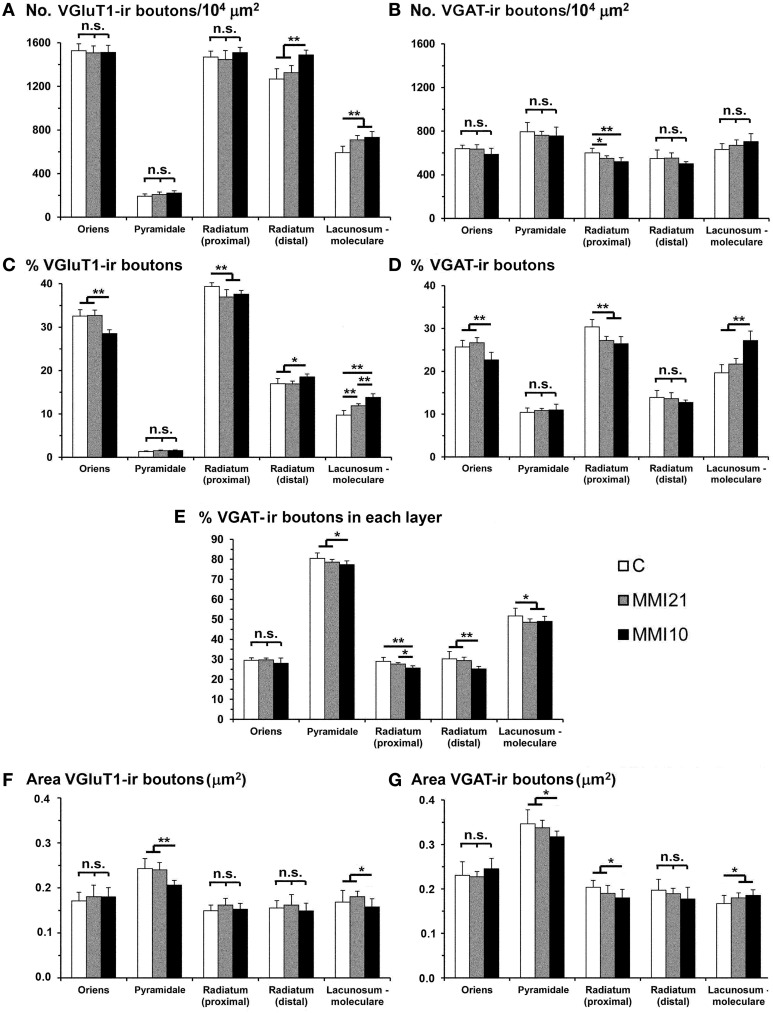
Figure 12.
VGluT1-ir and VGAT-ir bouton distribution in CA1 of C and MMI pups. Histograms showing the VGluT1-ir and VGAT-ir bouton distribution in CA1 of C and MMI pups. The VGluT1-ir and VGAT-ir bouton density increased in MMI stratum lacunosum-moleculare and decreased in proximal radiatum (A,B). Significant differences between C and MMI VGluT1-ir bouton percentage were found in all the strata (C). VGAT-ir bouton percentage decreased in MMI10 stratum oriens, increased in MMI10 stratum lacunosum-moleculare, and decreased in MMI proximal radiatum (D). The VGAT-ir bouton percentage in each stratum decreased in MMI10 strata pyramidale and radiatum, and in MMI lacunossum-moleculare (E). VGluT1-ir bouton area decreased in MMI10 strata pyramidale and lacunosum-moleculare (F) and VGAT-ir bouton area decreased in MMI10 strata pyramidale and proximal radiatum, and increased in MMI stratum lacunosum-moleculare (G). n.s. indicates not significant differences; (*) and (**) indicate significant differences, P ≤ 0.05 and P ≤ 0.001, respectively.

