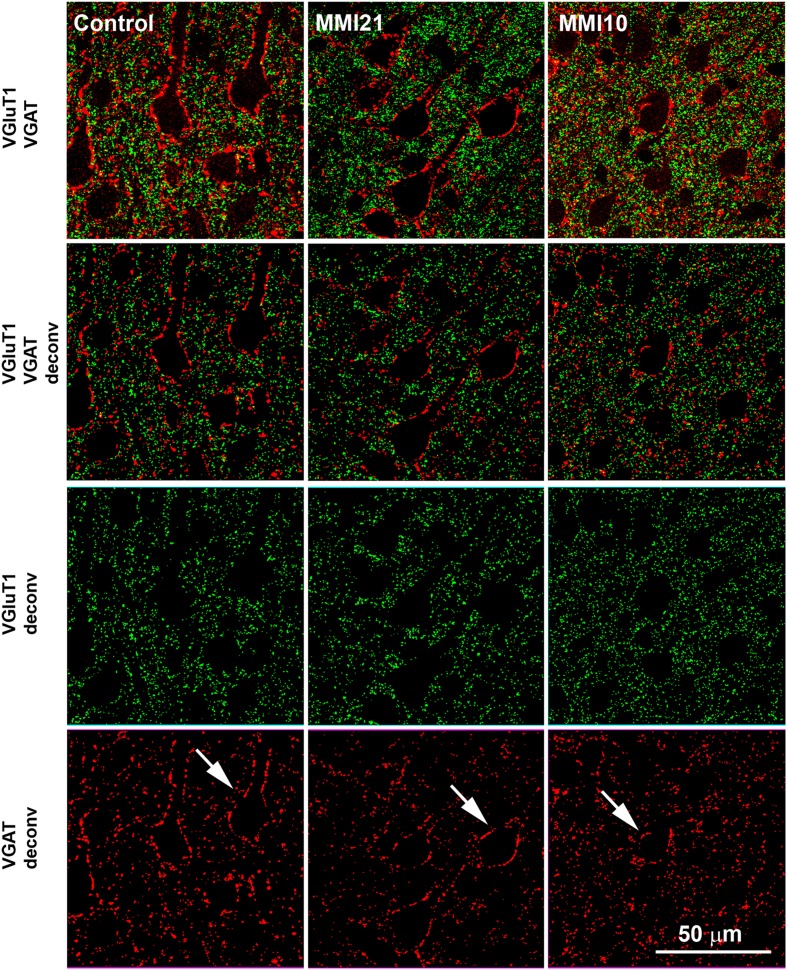
Figure 3.
Deconvoluted confocal images of the somatosensory cortex. Deconvoluted (deconv) confocal images of VGluT1-ir (green labeling) and VGAT-ir (red labeling) boutons in the layer V of the somatosensory cortex (S1). Bouton density and size was analyzed in VGluT1 and VGAT deconv images. In VGAT deconv images, perisomatic inhibitory VGAT-ir boutons are shown (arrows). Same scale for all images.

