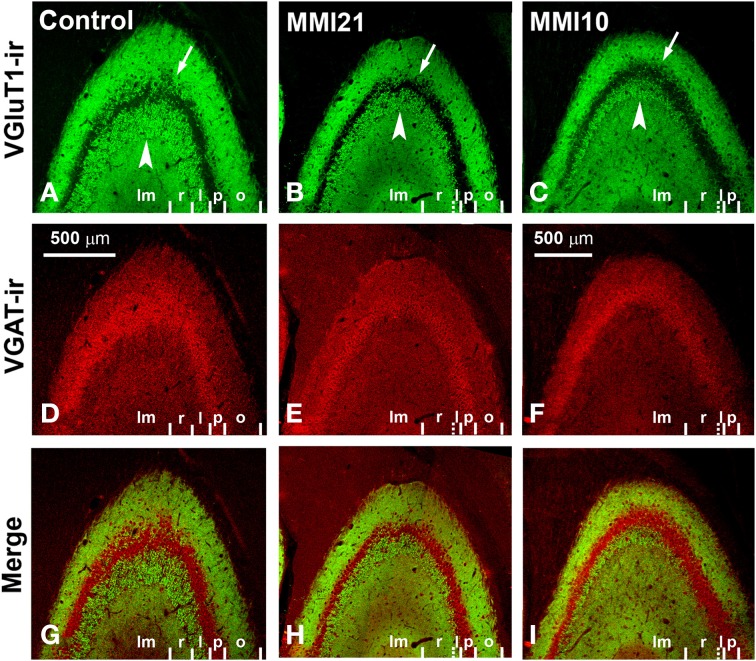
Figure 9.
Confocal immunolabeling in CA3 of C and MMI pups. Confocal photomicrographs showing VGluT1-ir (green labeling; A–C), VGAT-ir (red labeling; D–F) and merged images (G–I) in CA3 of C (A,D,G), MMI21 (B,E,H) and MMI10 (C,F,I) pups at P50. Note that the area occupied by VGluT1-ir mossy boutons in the strata oriens (o; arrows) and lucidum (l; arrowheads) of CA3 is less in MMI21 (B) and MMI10 (C) pups than in controls (A). The border between the strata lucidum (l) and radiatum (r) are marked in dashed lines in (B,C), owing to the low density of labeled boutons. p, Pyramidale; lm, lacunosum-moleculare. Same scale for (A–I).

