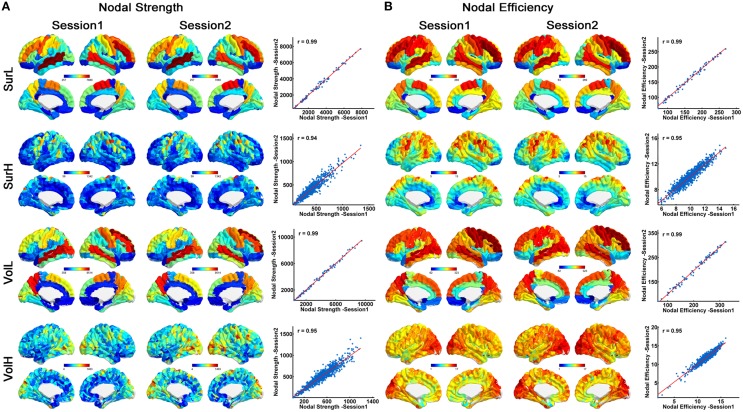
Figure 3.
The correlation of nodal properties between sessions. (A) Similar spatial patterns of nodal strength across regions and high correlation of nodal strength between two sessions are demonstrated. On the 3D surface, the nodes with strengths from low to high are represented with colors from blue to red. In the plot, the blue dots represent nodal strength and are linearly fitted with a red line between sessions. (B) Similar spatial patterns of nodal efficiency across regions and high correlation of nodal efficiency between two sessions are demonstrated. On the 3D surface, the nodes with efficiency from low to high are represented with colors from blue to red. In the plot, the blue dots represent nodal efficiency and are linearly fitted with a red line between sessions.

