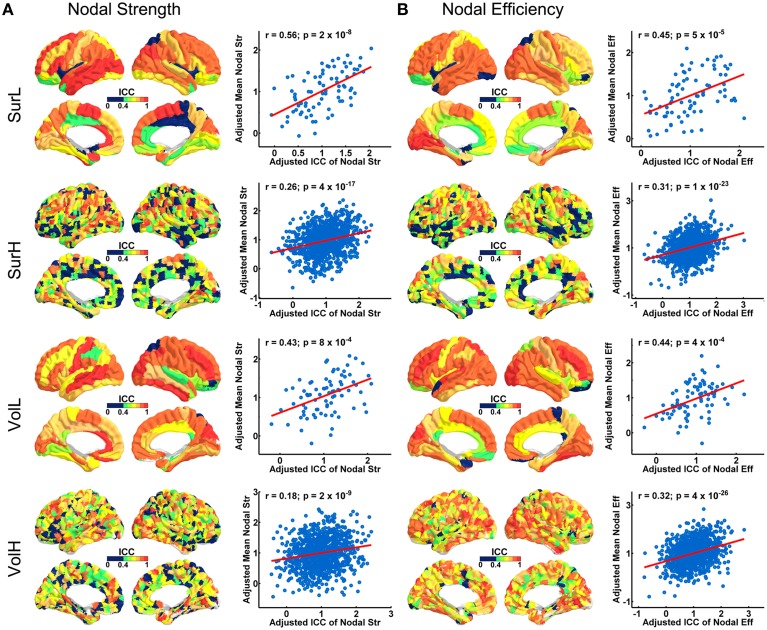
Figure 4.
The TRT reliability of regional network properties. (A) 3D representations of spatial distribution of ICC values of nodal strength across regions. The plots show the correlation between nodal strength and ICC values, with blue dots representing the nodes and the red line representing the linear fit. (B) 3D representations of the spatial distribution of ICC values of nodal efficiency across regions. The plots show the correlation between nodal efficiency and ICC values, with blue dots representing the node and the red line representing the linear fit. Notably, the nodal properties across all nodes were resampled into a Gaussian distribution.

