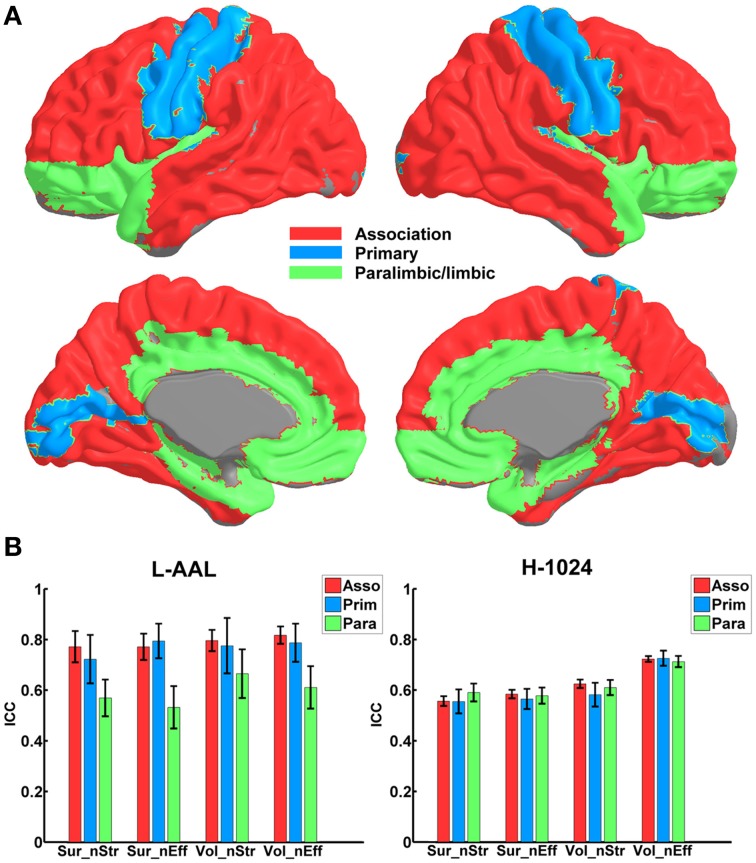
Figure 5.
The TRT reliability of nodal properties across different regional classes. (A) The regions are shown in red, blue and green on a 3D surface, indicating the association, primary and paralimbic/limbic cortices. (B) Statistical analysis of the nodal reliability between regional classes in the WM network. The bars and errorbars represent the mean values and standard errors, respectively, of the ICC values of all regions in each regional class. The ICCs of nodal strength and efficiency from surface- and volume-based networks were represented by Sur_nStr, Sur_nEff, Vol_nStr, and Vol_nEff, respectively.

