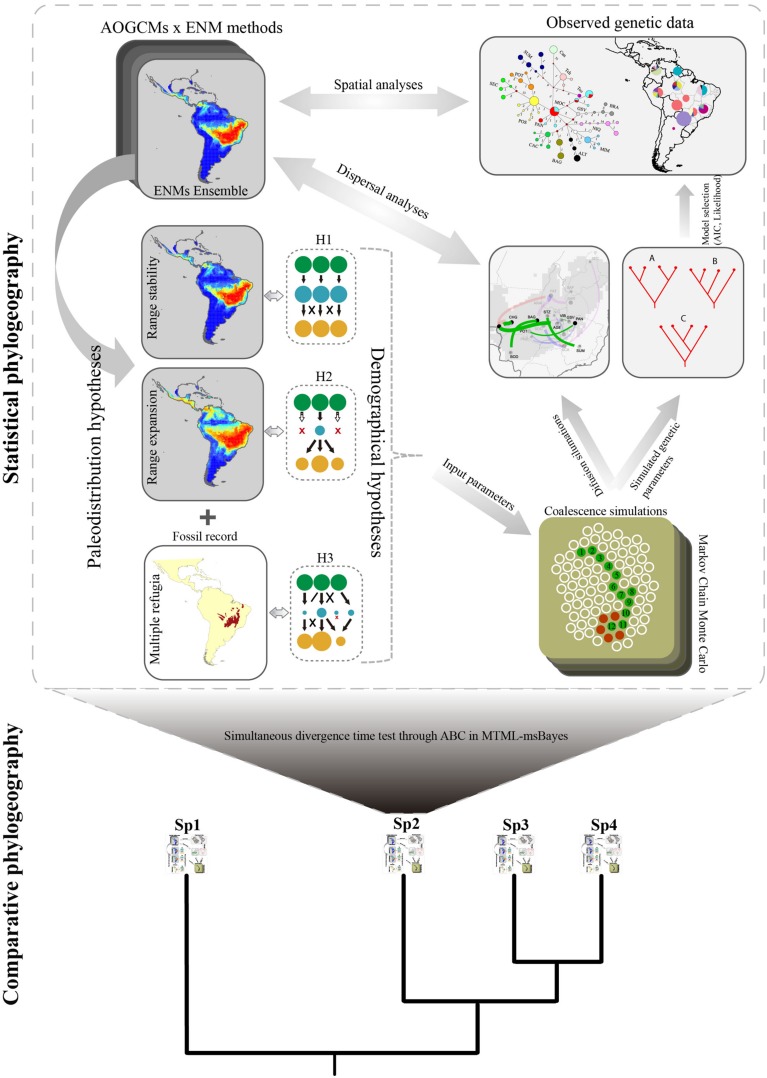
FIGURE 2.
Schematic view of the generalized framework for coupling ecological niche modeling, coalescent simulation, and diffusion model in a statistical comparative phylogeography approach. Palaeodistribution maps resulting from ENMs are used to generate demographic hypotheses (see Figure 1) in a spatially explicit context through time (hypotheses H1 and H2; colored circles represent the population dynamics), according to the range shifts in species distributions in the past (e.g., range retraction or range stability). Other hypotheses may also be set based on fossil records (hypothesis H3) or a priori biogeographic scenario. Uncertainties in setting alternative hypotheses can be incorporated into the framework using several ENM methods and projecting distributions through different AOGCMs. In a next step, simulated coalescence structures are compared with observed data in a model selection approach, allowing selecting among the demographic hypothesis (H1, H2, or H3) the most likely to generate the current phylogeographic structure derived from molecular data. At the same time, phylogeographic diffusion models allow reconstructing colonization routes that are compared with palaeodistribution maps. Finally, this framework can be expanded into a multi-species comparative approach allowing inferring how whole assemblages responded to the interplay between climate changes, geographic barriers, and demographic processes, shaping the current patterns of species distribution, and biodiversity. Coalescent time for each species can be compared using, for instance, Approximate Bayesian Computation implemented in MTML-msBayes. Representation of Markov Chain was adapted from Professor Peter Beerli Lecture Notes (http://evolution.gs.washington.edu).

