FIGURE 1.

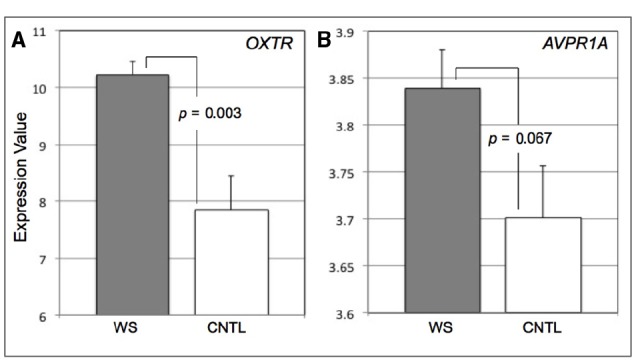
Bar graphs displaying expression values for OXTR (A) and AVPR1A (B) in Williams syndrome (WS) and healthy controls (CNTL). Error bars represent standard error from the mean.

Bar graphs displaying expression values for OXTR (A) and AVPR1A (B) in Williams syndrome (WS) and healthy controls (CNTL). Error bars represent standard error from the mean.